OPEN-SOURCE SCRIPT
EMA 100 / 200 / 300
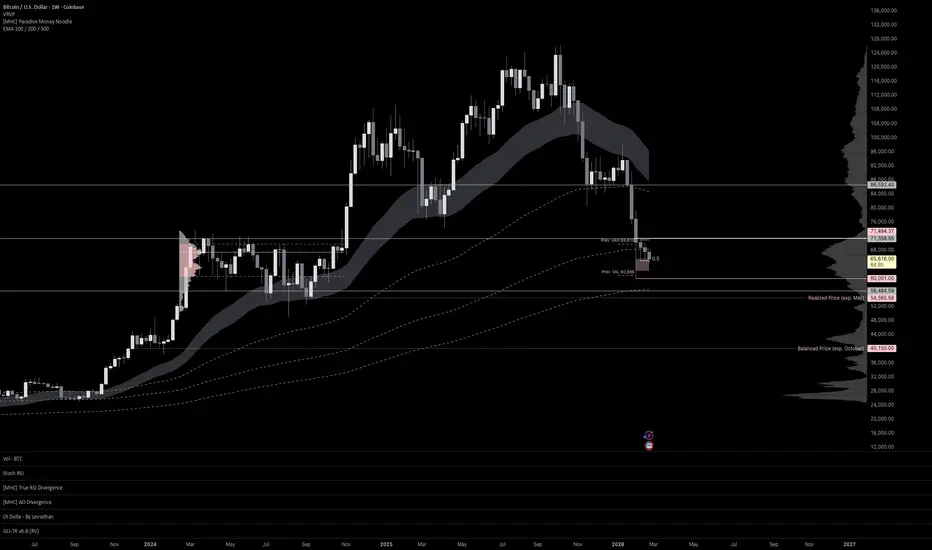
Short Description:
A clean overlay of three key Exponential Moving Averages (100, 200, 300) for trend identification and dynamic support/resistance.
Description:
This indicator plots three widely used Exponential Moving Averages directly on your chart:
🟡 EMA 100 – Medium-term trend filter
🔵 EMA 200 – The institutional benchmark for long-term trend direction
🔴 EMA 300 – Deep trend structure and macro support/resistance
How to use:
Price above all three EMAs → Strong bullish structure
Price below all three EMAs → Strong bearish structure
EMA crossovers and convergence/divergence signal potential trend shifts
Use as dynamic support & resistance zones on higher timeframes (4H, Daily, Weekly)
Features:
Fully customizable lengths via input settings
Clean and lightweight – no chart clutter
Works on all assets and timeframes
Best used in combination with volume, order flow, and key level analysis for high-confluence setups.
Script open-source
Dans l'esprit TradingView, le créateur de ce script l'a rendu open source afin que les traders puissent examiner et vérifier ses fonctionnalités. Bravo à l'auteur! Bien que vous puissiez l'utiliser gratuitement, n'oubliez pas que la republication du code est soumise à nos Règles.

Clause de non-responsabilité
Les informations et publications ne sont pas destinées à être, et ne constituent pas, des conseils ou recommandations financiers, d'investissement, de trading ou autres fournis ou approuvés par TradingView. Pour en savoir plus, consultez les Conditions d'utilisation.
Script open-source
Dans l'esprit TradingView, le créateur de ce script l'a rendu open source afin que les traders puissent examiner et vérifier ses fonctionnalités. Bravo à l'auteur! Bien que vous puissiez l'utiliser gratuitement, n'oubliez pas que la republication du code est soumise à nos Règles.
Clause de non-responsabilité
Les informations et publications ne sont pas destinées à être, et ne constituent pas, des conseils ou recommandations financiers, d'investissement, de trading ou autres fournis ou approuvés par TradingView. Pour en savoir plus, consultez les Conditions d'utilisation.