OPEN-SOURCE SCRIPT
R2D2 Buy-Sell Indicator v1.5
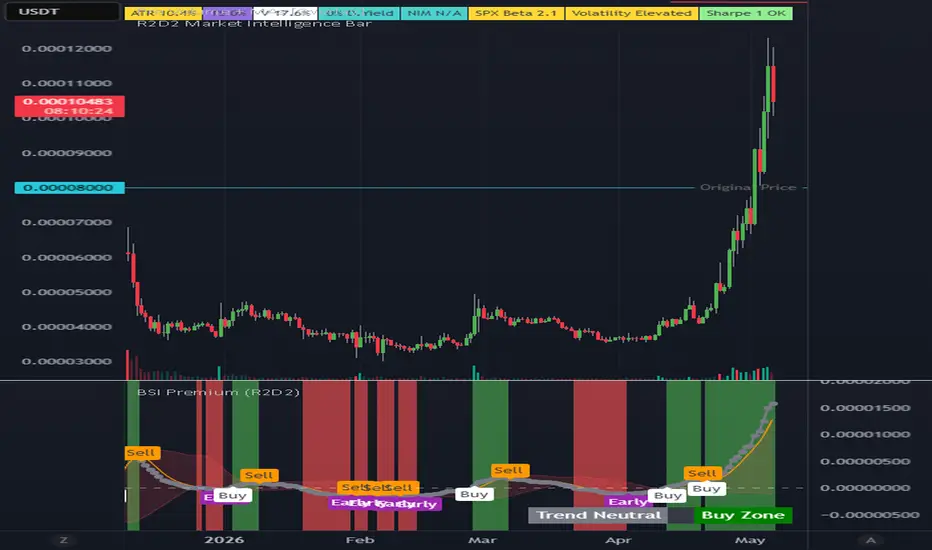
BSI Premium - Advanced Trend, Zone & Momentum System
Summary: A highly customizable, all-in-one momentum and trend indicator. BSI Premium features 6 unique trend states, high-conviction "Early Buy" signals, dynamically shaded trade zones, and a powerful multi-condition alert engine for automated scanning.
Description:
Overview
Welcome to the BSI Premium (Buy Sell Indicator). This script is designed to act as a complete, standalone trading system or a powerful confluence tool alongside your existing strategy. By combining smoothed momentum oscillators, dynamic Bollinger Band clouds, and strict zero-line threshold logic, BSI Premium cuts through market noise to give you clear, actionable insights into short-term trends.
Whether you are looking for lower-risk entries, managing active positions, or hunting for high-reward reversal setups, BSI Premium visually guides you through every stage of the market cycle.
🔥 Key Features
1. The 6-State Trend Engine
Instead of simple red and green, BSI Premium analyzes momentum and signal crossovers to define 6 specific micro-trends, visually plotted directly on the oscillator line:
Bright Green Dots: Trend Bullish (Momentum is accelerating in the Buy Zone).
Dark Green Dots: Fading Bull (In the Buy Zone, but losing strength).
Yellow Dots: Early Buy Setup (Momentum is improving below the zero line).
Red Dots: Trend Bearish (Momentum is falling in the Warning Zone).
Dark Red Dots: Improving Bear (In the Warning Zone, but things are getting better).
Grey Dots: Neutral (No clear short-term trend).
2. Precision Action Signals
Early Buy (Purple Bubble): Triggers the first day conditions are met below the zero line. This is designed for high-conviction stocks and offers a higher risk/reward entry.
Standard Buy (White Bubble): Triggers when conditions are met above the zero line, indicating a lower-risk entry point.
Sell (Orange Bubble): Shows possible times to take profits or tighten stop losses.
3. Visual Trade Zones & Bollinger Clouds
The chart background automatically shades Green (Buy Zones) and Red (Warning Zones) only when momentum strictly agrees with the signal line. Transitional periods are left unshaded (black), keeping your chart clean during chop. Furthermore, dynamic Bollinger Band Clouds wrap the oscillator, helping you visualize overextended momentum or squeeze conditions.
4. Ultimate Customization (14 Inputs)
Every asset breathes differently. BSI Premium allows you to fully customize the mathematical core of the indicator. You can individually change the Fast, Slow, and Signal moving average types (choose between SMA, EMA, WMA, HullMA, and Wilders RMA), adjust lengths, and tweak Bollinger Band multipliers to fit your exact trading style.
🔔 The Multi-Condition Alert Engine (Scanner Ready)
A powerful, unique feature of BSI Premium is its built-in alert engine. You can easily create automated Trade Alerts for any symbol, on any timeframe, without writing code.
Using TradingView's alert menu, you can set up pop-ups, emails, or SMS notifications for 7 distinct conditions, complete with dynamic ticker and price data:
Early Buy Signals
Standard Buy Signals
Sell Signals
Entering the Green Buy Zone
Entering the Red Warning Zone
Momentum crossing Above the Cloud
Momentum crossing Below the Cloud
📖 How to Trade with BSI Premium
"In The Red, You’re Dead": The general rule of thumb is to avoid buying or adding to positions while in the Red Warning Zone. Most standard buy signals happen outside of this zone (with exceptions for momentum squeezes and deep reversals).
Zone Management: Use the green shaded areas to actively look for long entries. Conversely, use the red zones to tighten stops or consider closing out positions.
The "Early" Advantage: Use the Early Buy signal to enter high-conviction stocks at the bottom of a cycle for maximum risk/reward, scaling into the rest of your position when the Standard Buy triggers.
Confluence: BSI Premium works beautifully by itself, but it can also be paired with volume oscillators or broader market indicators to confirm entries.
Disclaimer: This script is for educational and informational purposes only. It does not constitute financial advice. Past performance is not indicative of future results. Always practice proper risk management and backtest indicators before using them with real capital.
Summary: A highly customizable, all-in-one momentum and trend indicator. BSI Premium features 6 unique trend states, high-conviction "Early Buy" signals, dynamically shaded trade zones, and a powerful multi-condition alert engine for automated scanning.
Description:
Overview
Welcome to the BSI Premium (Buy Sell Indicator). This script is designed to act as a complete, standalone trading system or a powerful confluence tool alongside your existing strategy. By combining smoothed momentum oscillators, dynamic Bollinger Band clouds, and strict zero-line threshold logic, BSI Premium cuts through market noise to give you clear, actionable insights into short-term trends.
Whether you are looking for lower-risk entries, managing active positions, or hunting for high-reward reversal setups, BSI Premium visually guides you through every stage of the market cycle.
🔥 Key Features
1. The 6-State Trend Engine
Instead of simple red and green, BSI Premium analyzes momentum and signal crossovers to define 6 specific micro-trends, visually plotted directly on the oscillator line:
Bright Green Dots: Trend Bullish (Momentum is accelerating in the Buy Zone).
Dark Green Dots: Fading Bull (In the Buy Zone, but losing strength).
Yellow Dots: Early Buy Setup (Momentum is improving below the zero line).
Red Dots: Trend Bearish (Momentum is falling in the Warning Zone).
Dark Red Dots: Improving Bear (In the Warning Zone, but things are getting better).
Grey Dots: Neutral (No clear short-term trend).
2. Precision Action Signals
Early Buy (Purple Bubble): Triggers the first day conditions are met below the zero line. This is designed for high-conviction stocks and offers a higher risk/reward entry.
Standard Buy (White Bubble): Triggers when conditions are met above the zero line, indicating a lower-risk entry point.
Sell (Orange Bubble): Shows possible times to take profits or tighten stop losses.
3. Visual Trade Zones & Bollinger Clouds
The chart background automatically shades Green (Buy Zones) and Red (Warning Zones) only when momentum strictly agrees with the signal line. Transitional periods are left unshaded (black), keeping your chart clean during chop. Furthermore, dynamic Bollinger Band Clouds wrap the oscillator, helping you visualize overextended momentum or squeeze conditions.
4. Ultimate Customization (14 Inputs)
Every asset breathes differently. BSI Premium allows you to fully customize the mathematical core of the indicator. You can individually change the Fast, Slow, and Signal moving average types (choose between SMA, EMA, WMA, HullMA, and Wilders RMA), adjust lengths, and tweak Bollinger Band multipliers to fit your exact trading style.
🔔 The Multi-Condition Alert Engine (Scanner Ready)
A powerful, unique feature of BSI Premium is its built-in alert engine. You can easily create automated Trade Alerts for any symbol, on any timeframe, without writing code.
Using TradingView's alert menu, you can set up pop-ups, emails, or SMS notifications for 7 distinct conditions, complete with dynamic ticker and price data:
Early Buy Signals
Standard Buy Signals
Sell Signals
Entering the Green Buy Zone
Entering the Red Warning Zone
Momentum crossing Above the Cloud
Momentum crossing Below the Cloud
📖 How to Trade with BSI Premium
"In The Red, You’re Dead": The general rule of thumb is to avoid buying or adding to positions while in the Red Warning Zone. Most standard buy signals happen outside of this zone (with exceptions for momentum squeezes and deep reversals).
Zone Management: Use the green shaded areas to actively look for long entries. Conversely, use the red zones to tighten stops or consider closing out positions.
The "Early" Advantage: Use the Early Buy signal to enter high-conviction stocks at the bottom of a cycle for maximum risk/reward, scaling into the rest of your position when the Standard Buy triggers.
Confluence: BSI Premium works beautifully by itself, but it can also be paired with volume oscillators or broader market indicators to confirm entries.
Disclaimer: This script is for educational and informational purposes only. It does not constitute financial advice. Past performance is not indicative of future results. Always practice proper risk management and backtest indicators before using them with real capital.
Script open-source
Dans l'esprit TradingView, le créateur de ce script l'a rendu open source afin que les traders puissent examiner et vérifier ses fonctionnalités. Bravo à l'auteur! Bien que vous puissiez l'utiliser gratuitement, n'oubliez pas que la republication du code est soumise à nos Règles.

Clause de non-responsabilité
Les informations et publications ne sont pas destinées à être, et ne constituent pas, des conseils ou recommandations financiers, d'investissement, de trading ou autres fournis ou approuvés par TradingView. Pour en savoir plus, consultez les Conditions d'utilisation.
Script open-source
Dans l'esprit TradingView, le créateur de ce script l'a rendu open source afin que les traders puissent examiner et vérifier ses fonctionnalités. Bravo à l'auteur! Bien que vous puissiez l'utiliser gratuitement, n'oubliez pas que la republication du code est soumise à nos Règles.
Clause de non-responsabilité
Les informations et publications ne sont pas destinées à être, et ne constituent pas, des conseils ou recommandations financiers, d'investissement, de trading ou autres fournis ou approuvés par TradingView. Pour en savoir plus, consultez les Conditions d'utilisation.