PGO Ensemble [MiesOnCharts]
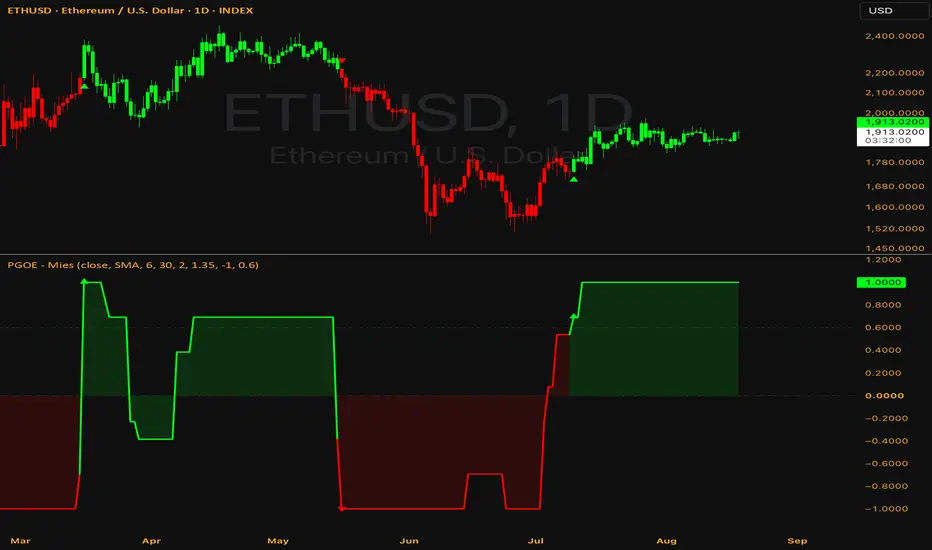
An ensemble of Pretty Good Oscillators, one for every length in a range. Each one measures how far price sits from its own moving average, in units of its own average true range, and each holds a long or short state. The plotted score is the margin of the vote across them, running from -1 when every member is short to +1 when every member is long.
Built with daily bars in mind. The inputs adjust for other timeframes.
What PGO measures
Displacement from a moving average, divided by ATR over the same length. A reading of 2 means price sits two typical bars away from its own mean. Dividing by range is what makes it portable: the same number means the same thing on any symbol at any price.
Why an ensemble
Any single length is an arbitrary pick, and the best one is only obvious afterwards. Short lengths react fast and whipsaw. Long lengths are steady and late.
The reason this works on PGO in particular is the ATR division. Raw distance from a mean cannot be pooled across lengths, because a long average sits further from price by construction and would dominate any average of the two. Dividing by range over the same length puts every member in identical units, so a short member disagreeing with a long one is real information rather than an artefact of scale.
Members hold a state, not a reading
Each member latches long when it clears the upper threshold and stays long until it breaks the lower one. The vote counts positions rather than values, so a brief dip does not flip a member back.
The two thresholds are asymmetric on purpose. Price spends more time stretched above its mean than below in most markets, and a symmetric pair produces a permanent long bias.
A member that has never crossed either threshold contributes nothing. Early in a chart's history the score is muted for that reason, which is correct. Those members have no opinion yet.
Signals
Score at or above the trend threshold turns the state to uptrend and everything green. At or below the mirror of it, downtrend and red. In between, the previous state holds, so a brief loss of agreement does not end a regime.
Triangles mark each flip in the pane and on the price chart, the candles carry the regime colour, and both flips have alerts.
Inputs
How to use it
Limits
Credits
The Pretty Good Oscillator is Mark Johnson's. The TradingView implementation is Alex Orekhov's (everget). This script was inspired by QuantLapse's PGO variant, which is where the latching state and the asymmetric thresholds come from. The ensemble, the vote across it and the reconstruction of the members are the additions here.
Disclaimer
This indicator is provided for educational and informational purposes only and does not constitute financial, investment, or trading advice, nor a recommendation to buy or sell any asset.
Built with daily bars in mind. The inputs adjust for other timeframes.
What PGO measures
Displacement from a moving average, divided by ATR over the same length. A reading of 2 means price sits two typical bars away from its own mean. Dividing by range is what makes it portable: the same number means the same thing on any symbol at any price.
Why an ensemble
Any single length is an arbitrary pick, and the best one is only obvious afterwards. Short lengths react fast and whipsaw. Long lengths are steady and late.
The reason this works on PGO in particular is the ATR division. Raw distance from a mean cannot be pooled across lengths, because a long average sits further from price by construction and would dominate any average of the two. Dividing by range over the same length puts every member in identical units, so a short member disagreeing with a long one is real information rather than an artefact of scale.
Members hold a state, not a reading
Each member latches long when it clears the upper threshold and stays long until it breaks the lower one. The vote counts positions rather than values, so a brief dip does not flip a member back.
The two thresholds are asymmetric on purpose. Price spends more time stretched above its mean than below in most markets, and a symmetric pair produces a permanent long bias.
A member that has never crossed either threshold contributes nothing. Early in a chart's history the score is muted for that reason, which is correct. Those members have no opinion yet.
Signals
Score at or above the trend threshold turns the state to uptrend and everything green. At or below the mirror of it, downtrend and red. In between, the previous state holds, so a brief loss of agreement does not end a regime.
Triangles mark each flip in the pane and on the price chart, the candles carry the regime colour, and both flips have alerts.
Inputs
- Source and MA Type: the price series, and the average each member measures displacement from. VWMA falls back to the simple average on symbols that carry no volume.
- Min Length, Max Length and Length Step: the range and spacing of the ensemble. A wider span mixes more timescales and gives a smoother score. Every member costs the same regardless of its length, so range is cheap here.
- Long Threshold and Short Threshold: how far a member must be displaced before it latches.
- Trend Threshold: how much of the ensemble must agree before the regime flips. Higher is more selective and later.
- Flat When Split: whether an undecided ensemble holds the last regime or drops to flat.
- Display toggles for the fill, the chart candles and the flip arrows.
How to use it
- Read the colour as a regime filter rather than an entry.
- Watch the score when it sits away from its extremes. A trend running with only half the ensemble behind it is resting on the short members alone.
- Displacement is not direction. A member can be latched long while price falls, because it is still stretched above its mean.
Limits
- It is reactive. It describes displacement that has already happened and will lag turns.
- Nearby lengths give similar answers, so a narrow range delivers less of the averaging benefit than a wide one.
- Latching cuts both ways. It holds a member through noise, and it also holds it too long when a move genuinely ends.
- The asymmetric thresholds assume the usual upward drift. On a market without one they should be evened out.
- No setting is right everywhere. Test on your own market and timeframe.
Credits
The Pretty Good Oscillator is Mark Johnson's. The TradingView implementation is Alex Orekhov's (everget). This script was inspired by QuantLapse's PGO variant, which is where the latching state and the asymmetric thresholds come from. The ensemble, the vote across it and the reconstruction of the members are the additions here.
Disclaimer
This indicator is provided for educational and informational purposes only and does not constitute financial, investment, or trading advice, nor a recommendation to buy or sell any asset.

Clause de non-responsabilité
Les informations et publications ne sont pas destinées à être, et ne constituent pas, des conseils ou recommandations financiers, d'investissement, de trading ou autres fournis ou approuvés par TradingView. Pour en savoir plus, consultez les Conditions d'utilisation.
Clause de non-responsabilité
Les informations et publications ne sont pas destinées à être, et ne constituent pas, des conseils ou recommandations financiers, d'investissement, de trading ou autres fournis ou approuvés par TradingView. Pour en savoir plus, consultez les Conditions d'utilisation.