OPEN-SOURCE SCRIPT
Dee MTF ATR Strategy + Alert (3 TPs)
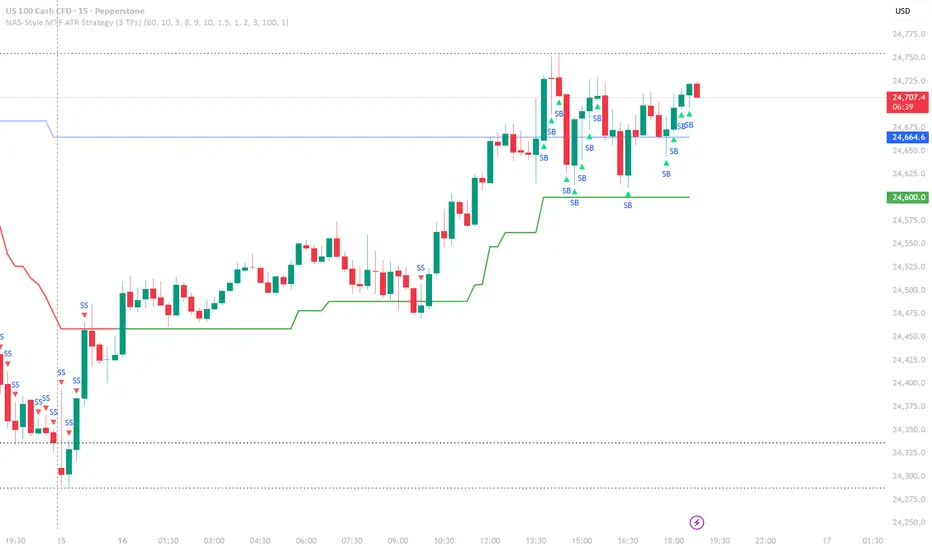
Dee MTF ATR Strategy follows these 7 clear, mechanical rules for entries, exits, and risk.
Entry Rules
Long Entry (Strong Buy)
Condition 1: LTF Supertrend is bullish (price above LTF Supertrend line).
Condition 2: HTF Supertrend is bullish (higher timeframe Supertrend direction = +1).
Condition 3: Fast SMA(8) ≥ Slow SMA(9) (momentum alignment).
Execution: Enter long at next bar’s open after all 3 conditions align.
Short Entry (Strong Sell)
Condition 1: LTF Supertrend is bearish (price below LTF Supertrend line).
Condition 2: HTF Supertrend is bearish (higher timeframe Supertrend direction = -1).
Condition 3: Fast SMA(8) ≤ Slow SMA(9) (momentum alignment).
Execution: Enter short at next bar’s open after all 3 conditions align.
Position rules: Only 1 position at a time (no pyramiding). No entry if already in a trade.
Exit Rules
For Long Trades
SL: Entry price - (ATR × 1.5) → dynamic trailing stop.
TP1: Entry price + (1.0 × Risk Distance) → exit 33% of position.
TP2: Entry price + (2.0 × Risk Distance) → exit 33% of position.
TP3: Entry price + (3.0 × Risk Distance) → exit 34% of position.
For Short Trades
SL: Entry price + (ATR × 1.5) → dynamic trailing stop.
TP1: Entry price - (1.0 × Risk Distance) → exit 33% of position.
TP2: Entry price - (2.0 × Risk Distance) → exit 33% of position.
TP3: Entry price - (3.0 × Risk Distance) → exit 34% of position.
Risk Distance = |Entry - SL| (so TP1 = 1R, TP2 = 2R, TP3 = 3R).
Risk Management Rules
Position Size:
Fixed: fixedQty contracts (default 1.0).
OR Risk‑based: Size so that SL hit = riskUsdPerTrade (default $100).
Commission: 0.01% per side (adjustable).
Order fill: On bar close (avoids intrabar repainting).
Visual Confirmation Checklist
When you see a SB (Strong Buy) triangle:
Blue HTF Supertrend line should be flat/up (not down).
Green LTF Supertrend line should be below price.
SMA(8) line above or touching SMA(9) line.
When you see a SS (Strong Sell) triangle:
Blue HTF Supertrend line should be flat/down (not up).
Red LTF Supertrend line should be above price.
SMA(8) line below or touching SMA(9) line.
Example Trade Plan (5m NAS100)
Strong Buy signal appears at 1.7500:
Entry: 1.7500
ATR(10): 0.0020
SL: 1.7500 - (1.5 × 0.0020) = 1.7470 (Risk = 30 points)
TP1: 1.7500 + (1 × 30) = 1.7530 (33% out)
TP2: 1.7500 + (2 × 30) = 1.7560 (33% out)
TP3: 1.7500 + (3 × 30) = 1.7590 (34% out)
Strategy Logic Summary
Core idea: Trade only when LTF momentum aligns with HTF trend, using ATR for objective risk/reward scaling.
Edge assumption: HTF trend filter reduces whipsaws, LTF momentum catches pullbacks into trend, 3R scaling captures trend continuation.
Entry Rules
Long Entry (Strong Buy)
Condition 1: LTF Supertrend is bullish (price above LTF Supertrend line).
Condition 2: HTF Supertrend is bullish (higher timeframe Supertrend direction = +1).
Condition 3: Fast SMA(8) ≥ Slow SMA(9) (momentum alignment).
Execution: Enter long at next bar’s open after all 3 conditions align.
Short Entry (Strong Sell)
Condition 1: LTF Supertrend is bearish (price below LTF Supertrend line).
Condition 2: HTF Supertrend is bearish (higher timeframe Supertrend direction = -1).
Condition 3: Fast SMA(8) ≤ Slow SMA(9) (momentum alignment).
Execution: Enter short at next bar’s open after all 3 conditions align.
Position rules: Only 1 position at a time (no pyramiding). No entry if already in a trade.
Exit Rules
For Long Trades
SL: Entry price - (ATR × 1.5) → dynamic trailing stop.
TP1: Entry price + (1.0 × Risk Distance) → exit 33% of position.
TP2: Entry price + (2.0 × Risk Distance) → exit 33% of position.
TP3: Entry price + (3.0 × Risk Distance) → exit 34% of position.
For Short Trades
SL: Entry price + (ATR × 1.5) → dynamic trailing stop.
TP1: Entry price - (1.0 × Risk Distance) → exit 33% of position.
TP2: Entry price - (2.0 × Risk Distance) → exit 33% of position.
TP3: Entry price - (3.0 × Risk Distance) → exit 34% of position.
Risk Distance = |Entry - SL| (so TP1 = 1R, TP2 = 2R, TP3 = 3R).
Risk Management Rules
Position Size:
Fixed: fixedQty contracts (default 1.0).
OR Risk‑based: Size so that SL hit = riskUsdPerTrade (default $100).
Commission: 0.01% per side (adjustable).
Order fill: On bar close (avoids intrabar repainting).
Visual Confirmation Checklist
When you see a SB (Strong Buy) triangle:
Blue HTF Supertrend line should be flat/up (not down).
Green LTF Supertrend line should be below price.
SMA(8) line above or touching SMA(9) line.
When you see a SS (Strong Sell) triangle:
Blue HTF Supertrend line should be flat/down (not up).
Red LTF Supertrend line should be above price.
SMA(8) line below or touching SMA(9) line.
Example Trade Plan (5m NAS100)
Strong Buy signal appears at 1.7500:
Entry: 1.7500
ATR(10): 0.0020
SL: 1.7500 - (1.5 × 0.0020) = 1.7470 (Risk = 30 points)
TP1: 1.7500 + (1 × 30) = 1.7530 (33% out)
TP2: 1.7500 + (2 × 30) = 1.7560 (33% out)
TP3: 1.7500 + (3 × 30) = 1.7590 (34% out)
Strategy Logic Summary
Core idea: Trade only when LTF momentum aligns with HTF trend, using ATR for objective risk/reward scaling.
Edge assumption: HTF trend filter reduces whipsaws, LTF momentum catches pullbacks into trend, 3R scaling captures trend continuation.
Script open-source
Dans l'esprit TradingView, le créateur de ce script l'a rendu open source afin que les traders puissent examiner et vérifier ses fonctionnalités. Bravo à l'auteur! Bien que vous puissiez l'utiliser gratuitement, n'oubliez pas que la republication du code est soumise à nos Règles.

Clause de non-responsabilité
Les informations et publications ne sont pas destinées à être, et ne constituent pas, des conseils ou recommandations financiers, d'investissement, de trading ou autres fournis ou approuvés par TradingView. Pour en savoir plus, consultez les Conditions d'utilisation.
Script open-source
Dans l'esprit TradingView, le créateur de ce script l'a rendu open source afin que les traders puissent examiner et vérifier ses fonctionnalités. Bravo à l'auteur! Bien que vous puissiez l'utiliser gratuitement, n'oubliez pas que la republication du code est soumise à nos Règles.
Clause de non-responsabilité
Les informations et publications ne sont pas destinées à être, et ne constituent pas, des conseils ou recommandations financiers, d'investissement, de trading ou autres fournis ou approuvés par TradingView. Pour en savoir plus, consultez les Conditions d'utilisation.