Cost Floor Painter [BSL]
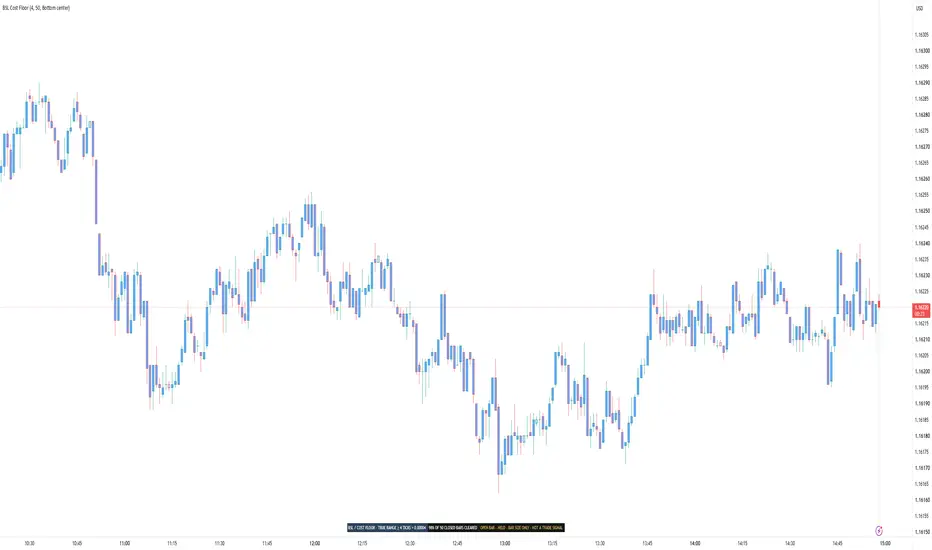
Is this bar even big enough to pay for its own round trip?
Most people pick a timeframe before they ever ask that. Cost Floor Painter
[BSL] answers it for every bar on the chart, and then reports how often the
answer was yes.
HOW IT ANSWERS
You enter a round-trip cost once, in ticks: your spread plus your commission
plus whatever slippage you expect to pay. The script converts that to a price
distance using the instrument's own tick size, so the same setting keeps
working when you switch symbols.
Every closed bar is then measured against it. A bar that covered the cost is
painted solid. A bar that did not is painted in the SAME colour, faded. A
single-row panel reports how many of the last 50 closed bars cleared, with the
50 printed beside it.
The measurement is true range, not high minus low. If a session opened away
from the previous close, that jump is distance the instrument actually
travelled, and counting it is the honest reading. The panel names this on its
face, TRUE RANGE followed by your cost in ticks and in price, so you can see
which definition produced the number. Cost-to-Range Gauge [BSL] measures the
same predicate over a window and names it the same way, so two tools that
agree by construction can be seen to agree.
A bar whose range lands exactly on the cost counts as covered.
WHERE THE READING BITES
On daily bars almost everything clears, whatever cost you enter. A day of
EURUSD moves eighty pips and a round trip costs two; the comparison is not
close and the panel will read 100%. That is a true answer and a dull one. The
reading gets interesting on the timeframes where bar size and cost are the
same order of magnitude, which for most instruments means minutes rather than
days. Checked on 2026-09-04: at the default cost, BTCUSDT, AAPL and EURUSD all
read 100% on the daily.
WHY FAILING BARS ARE THE SAME COLOUR
A second colour would say: this is a different kind of bar. It is not. A bar
one tick short of the cost is not a different animal from one a tick over, and
colouring it separately would invent a boundary the market does not have.
Fading says: the same kind of thing, weaker. That is the true statement, and
it is the only claim the paint makes.
THE BAR STILL OPEN GETS NO VERDICT
The current bar is drawn as an outline. It is never painted, never counted and
never published, because its range can still change. Whatever it looks like
now, it has not finished being a bar.
THE COST IS YOURS AND THE SCRIPT CANNOT CHECK IT
Spread, commission and slippage are numbers you supply. No chart indicator can
read your broker's fee schedule, and this one does not pretend to. If your
figure is wrong, every reading here is wrong by the same amount, and that is
why the panel shows the conversion from ticks to price, so you can
sanity-check it against your own fills.
WHAT YOU CAN SET
- Round-trip cost: 4.0 ticks
- Coverage window: 50 closed bars
- Colour the bars: on
- Outline the forming bar: on
- Panel position: Bottom center
There are six positions to choose from and the panel starts at the bottom
center. That is the strip TradingView leaves empty. The chart legend and the
trading buttons live top left, the platform's own logo sits bottom left and
covers whatever starts there, and the price scale takes the right. Move it if it
covers something.
The two display switches change the picture and nothing else. Turn the paint
off and the counts, the share and the published value are identical.
Below 50 closed bars there is no share at all. The panel says how many bars it
has instead of dividing by a number it does not have.
WHERE IT REFUSES TO WORK
Heikin Ashi, Renko, Kagi, Point & Figure and Range charts build their bars
from the market rather than showing them. The range of a constructed bar is
not the distance a trade would have paid for, so measuring a cost against it
would produce a number that looks right and means nothing.
On those chart types the paint, the share and the published value stop, the
background carries a wash you cannot miss, and the panel collapses to one
frozen row naming the chart type.
WHAT OTHER SCRIPTS CAN READ
One value is published for other indicators to pick up in their Source
setting: whether the bar cleared the cost. It is 1 for a bar that covered it,
0 for a bar that did not, and no value at all before the script has an
opinion. That is not the same as a 0.
That value is a filter, not a signal. It describes bar size and carries no
direction. It says nothing about whether to be long or short, and connecting
it to a tool that expects entry events would produce entries nobody signalled:
the value sits at 1 for every large bar in a row, and a tool reading events
would treat each change from 0 to 1 as a fresh instruction.
The dropdown will show more than this one value. The outline drawn on the
forming bar is offered there too, along with the two alert conditions, and the
outline is switched off by a display box. Take the value named above.
WHAT IT WILL NOT TELL YOU
It never reports what happened after a bar cleared the cost. There is no
direction in it, no entry, no exit, no stop and no position size. It
recommends no timeframe, no instrument and no cost figure. No percentage
appears anywhere without the number it was divided by.
What a cost does to a sequence of trades is a different question, answered by
Execution-Aware Trend [BSL], where the same figure becomes an executed cost
with next-bar fills and a fixed in-sample / out-of-sample split.
This tool describes bar size against a cost you declare. It does not predict
price, guarantee performance or provide trading advice. Validate the behaviour
on your own symbols, timeframes and execution assumptions before making
decisions.
Open-source Pine Script® v6. Educational use only.
Most people pick a timeframe before they ever ask that. Cost Floor Painter
[BSL] answers it for every bar on the chart, and then reports how often the
answer was yes.
HOW IT ANSWERS
You enter a round-trip cost once, in ticks: your spread plus your commission
plus whatever slippage you expect to pay. The script converts that to a price
distance using the instrument's own tick size, so the same setting keeps
working when you switch symbols.
Every closed bar is then measured against it. A bar that covered the cost is
painted solid. A bar that did not is painted in the SAME colour, faded. A
single-row panel reports how many of the last 50 closed bars cleared, with the
50 printed beside it.
The measurement is true range, not high minus low. If a session opened away
from the previous close, that jump is distance the instrument actually
travelled, and counting it is the honest reading. The panel names this on its
face, TRUE RANGE followed by your cost in ticks and in price, so you can see
which definition produced the number. Cost-to-Range Gauge [BSL] measures the
same predicate over a window and names it the same way, so two tools that
agree by construction can be seen to agree.
A bar whose range lands exactly on the cost counts as covered.
WHERE THE READING BITES
On daily bars almost everything clears, whatever cost you enter. A day of
EURUSD moves eighty pips and a round trip costs two; the comparison is not
close and the panel will read 100%. That is a true answer and a dull one. The
reading gets interesting on the timeframes where bar size and cost are the
same order of magnitude, which for most instruments means minutes rather than
days. Checked on 2026-09-04: at the default cost, BTCUSDT, AAPL and EURUSD all
read 100% on the daily.
WHY FAILING BARS ARE THE SAME COLOUR
A second colour would say: this is a different kind of bar. It is not. A bar
one tick short of the cost is not a different animal from one a tick over, and
colouring it separately would invent a boundary the market does not have.
Fading says: the same kind of thing, weaker. That is the true statement, and
it is the only claim the paint makes.
THE BAR STILL OPEN GETS NO VERDICT
The current bar is drawn as an outline. It is never painted, never counted and
never published, because its range can still change. Whatever it looks like
now, it has not finished being a bar.
THE COST IS YOURS AND THE SCRIPT CANNOT CHECK IT
Spread, commission and slippage are numbers you supply. No chart indicator can
read your broker's fee schedule, and this one does not pretend to. If your
figure is wrong, every reading here is wrong by the same amount, and that is
why the panel shows the conversion from ticks to price, so you can
sanity-check it against your own fills.
WHAT YOU CAN SET
- Round-trip cost: 4.0 ticks
- Coverage window: 50 closed bars
- Colour the bars: on
- Outline the forming bar: on
- Panel position: Bottom center
There are six positions to choose from and the panel starts at the bottom
center. That is the strip TradingView leaves empty. The chart legend and the
trading buttons live top left, the platform's own logo sits bottom left and
covers whatever starts there, and the price scale takes the right. Move it if it
covers something.
The two display switches change the picture and nothing else. Turn the paint
off and the counts, the share and the published value are identical.
Below 50 closed bars there is no share at all. The panel says how many bars it
has instead of dividing by a number it does not have.
WHERE IT REFUSES TO WORK
Heikin Ashi, Renko, Kagi, Point & Figure and Range charts build their bars
from the market rather than showing them. The range of a constructed bar is
not the distance a trade would have paid for, so measuring a cost against it
would produce a number that looks right and means nothing.
On those chart types the paint, the share and the published value stop, the
background carries a wash you cannot miss, and the panel collapses to one
frozen row naming the chart type.
WHAT OTHER SCRIPTS CAN READ
One value is published for other indicators to pick up in their Source
setting: whether the bar cleared the cost. It is 1 for a bar that covered it,
0 for a bar that did not, and no value at all before the script has an
opinion. That is not the same as a 0.
That value is a filter, not a signal. It describes bar size and carries no
direction. It says nothing about whether to be long or short, and connecting
it to a tool that expects entry events would produce entries nobody signalled:
the value sits at 1 for every large bar in a row, and a tool reading events
would treat each change from 0 to 1 as a fresh instruction.
The dropdown will show more than this one value. The outline drawn on the
forming bar is offered there too, along with the two alert conditions, and the
outline is switched off by a display box. Take the value named above.
WHAT IT WILL NOT TELL YOU
It never reports what happened after a bar cleared the cost. There is no
direction in it, no entry, no exit, no stop and no position size. It
recommends no timeframe, no instrument and no cost figure. No percentage
appears anywhere without the number it was divided by.
What a cost does to a sequence of trades is a different question, answered by
Execution-Aware Trend [BSL], where the same figure becomes an executed cost
with next-bar fills and a fixed in-sample / out-of-sample split.
This tool describes bar size against a cost you declare. It does not predict
price, guarantee performance or provide trading advice. Validate the behaviour
on your own symbols, timeframes and execution assumptions before making
decisions.
Open-source Pine Script® v6. Educational use only.

Clause de non-responsabilité
Les informations et publications ne sont pas destinées à être, et ne constituent pas, des conseils ou recommandations financiers, d'investissement, de trading ou autres fournis ou approuvés par TradingView. Pour en savoir plus, consultez les Conditions d'utilisation.
Clause de non-responsabilité
Les informations et publications ne sont pas destinées à être, et ne constituent pas, des conseils ou recommandations financiers, d'investissement, de trading ou autres fournis ou approuvés par TradingView. Pour en savoir plus, consultez les Conditions d'utilisation.