Mis à jour
PPT D/W/M/Y High Low
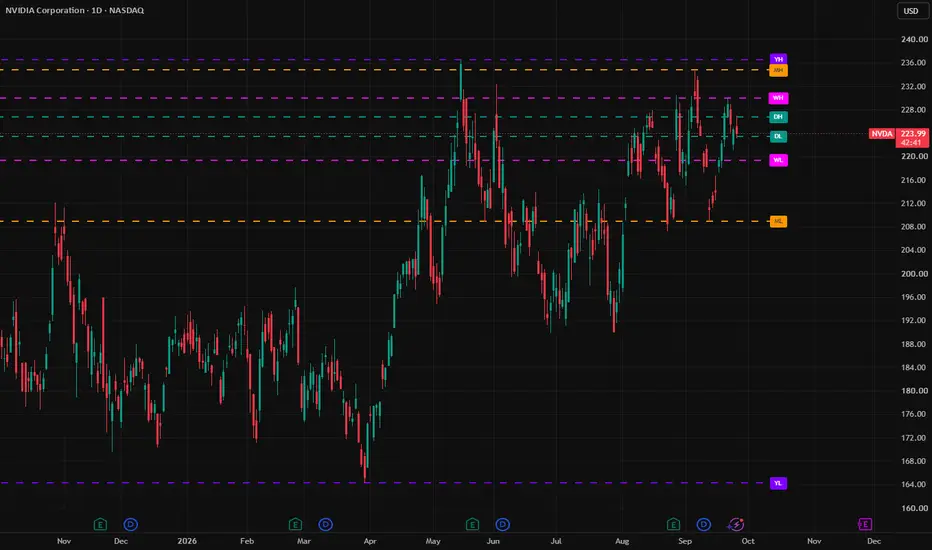
Plots the highest high and lowest low of four rolling windows, each measured back from the current moment:
Daily (DH / DL): last 24 hours
Weekly (WH / WL): last 7 days
Monthly (MH / ML): last 30 days
Yearly (YH / YL): last 365 days
These are rolling windows, not calendar periods. The weekly level always covers the past 7 days, whatever day of the week it is. Each level includes the bar that's still forming, so the lines update in real time when price makes a new high or low.
Each level is drawn as a horizontal line from the start of its window to a small colored tag at the right of the chart, so you can see which level is which at a glance.
Settings
Color, line style (solid, dashed or dotted), width and on/off for each set of levels
Option to extend lines to the left edge of the chart
Tag distance from the last bar, and tag size
Notes
The start of each window is found in steps: 5 minutes for daily, 15 minutes for weekly, 1 hour for monthly and 1 day for yearly. The high and low values are exact.
For markets that aren't open around the clock, the 24-hour window may contain no trading on weekends or holidays. The daily lines then stay hidden until trading resumes.
Daily (DH / DL): last 24 hours
Weekly (WH / WL): last 7 days
Monthly (MH / ML): last 30 days
Yearly (YH / YL): last 365 days
These are rolling windows, not calendar periods. The weekly level always covers the past 7 days, whatever day of the week it is. Each level includes the bar that's still forming, so the lines update in real time when price makes a new high or low.
Each level is drawn as a horizontal line from the start of its window to a small colored tag at the right of the chart, so you can see which level is which at a glance.
Settings
Color, line style (solid, dashed or dotted), width and on/off for each set of levels
Option to extend lines to the left edge of the chart
Tag distance from the last bar, and tag size
Notes
The start of each window is found in steps: 5 minutes for daily, 15 minutes for weekly, 1 hour for monthly and 1 day for yearly. The high and low values are exact.
For markets that aren't open around the clock, the 24-hour window may contain no trading on weekends or holidays. The daily lines then stay hidden until trading resumes.
Notes de version
Corrected image
Clause de non-responsabilité
Les informations et publications ne sont pas destinées à être, et ne constituent pas, des conseils ou recommandations financiers, d'investissement, de trading ou autres fournis ou approuvés par TradingView. Pour en savoir plus, consultez les Conditions d'utilisation.
Clause de non-responsabilité
Les informations et publications ne sont pas destinées à être, et ne constituent pas, des conseils ou recommandations financiers, d'investissement, de trading ou autres fournis ou approuvés par TradingView. Pour en savoir plus, consultez les Conditions d'utilisation.