Mis à jour
Tatanka AMT Toolkit: Auction Market Structure
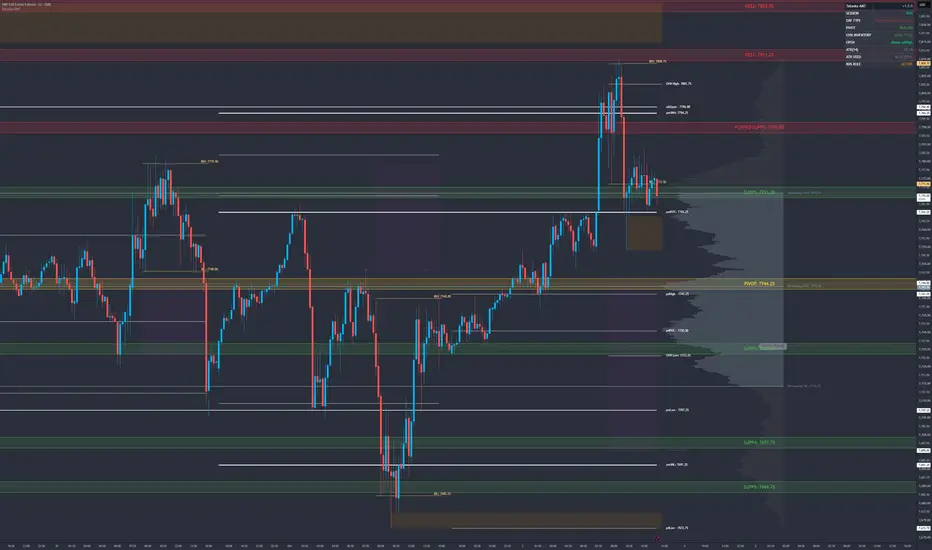
Tatanka AMT Toolkit puts a complete Auction Market Theory read on one chart. It is organized around the questions a Dalton-style read asks every session: Where is value? Is the market balanced or trending? Who is trapped? What is unfinished? Which reference prices matter? Where are my own levels?
It is built for CME futures (index, energy and metals) on minute charts. Every session time is CME exchange time (Central). The script gives no buy or sell signals and no trade recommendations.
WHY THESE PARTS ARE IN ONE SCRIPT
An auction read is one process, not a stack of separate indicators. Prior value shows where the market opened relative to fair price. The initial balance and range extension show whether that open is being accepted. Overnight inventory and the late-day spike show who may be forced to act. Naked POCs, single prints and poor highs and lows show what the auction left unfinished. Here the parts share one session clock, one tick and row-size engine and one dashboard, so their numbers agree, and the day-type read uses them together. Every part can be switched off on its own.
WHERE IS VALUE?
- Developing volume profile for the session, week (default), month or year, built from 1-minute bars, with POC, VAH and VAL (68% value area by default). Optional high-volume "walls" from the same profile.
- Prior-day POC, VAH and VAL from the RTH session.
- Prior-month POC, VAH, VAL, high and low.
- RTH VWAP anchored at the 8:30 CT open (off by default).
BALANCED OR TRENDING?
- Initial Balance (8:30-9:30 CT) with an optional midpoint.
- Day type, updated through the session from IB width versus daily ATR, range extension, breaks of prior-day and overnight structure, and value migration: Trend Day, Normal Day, Normal Variation, Neutral Day (center or extreme) or Non-Trend Day. Before the auction develops it shows Gap Up, Gap Down or Developing.
- Open location versus prior structure: above pdHigh, above pdVAH, inside value, below pdVAL or below pdLow.
- 80% Rule: when the session opens outside the prior day's value area, the value area is shaded. Once price has held inside it for 60 minutes, the setup is marked confirmed.
WHO IS TRAPPED?
- Overnight inventory: the share of overnight bars that traded above or below the prior settlement. When the whole overnight session sat on one side, the settlement line is marked as a trap and the day type shows TRAP.
- Late spike: the base of a breakout in the last 30 minutes of RTH (14:30-15:00 CT), with an alert when price comes back to test it.
WHAT IS UNFINISHED?
- Naked POCs (daily, weekly and monthly) that stay on the chart until price trades through them.
- Single prints from a 30-minute TPO profile of the RTH session, with tails filtered out.
- Poor highs and lows: a session extreme with two or more TPO periods at the same price.
WHICH REFERENCE PRICES MATTER?
- Overnight high and low (removed at 15:00 CT by default), previous day high and low, previous week high and low, previous month high and low, the weekly open (Sunday Globex) and the RTH open.
WHERE ARE MY LEVELS?
Paste your own levels into "Paste Levels Here" as one line: the date, the pivot, then any prices. Example:
2026-10-05, 5500.00, 5510.00, 5525.00, 5490.00, 5475.00
Prices above the pivot are drawn as resistance and prices below it as support, numbered outward from the pivot. Each level gets a zone sized by daily ATR or by ticks, flips color once price passes through it by a set ATR buffer, and can alert on crosses. The labeled form (Pivot Level / Resistance Levels / Support Levels lines) also works.
DASHBOARD
Session, day type, pivot bias (price versus your pasted pivot), overnight inventory, open location, daily ATR and ATR used, and 80% Rule status.
ALERTS
Optional alerts for crosses of your pasted levels, the IB, overnight high and low, RTH VWAP, prior-day high, low and value, prior-week and prior-month levels, the weekly open, and the developing POC, VAH and VAL, plus naked POC touches, spike-base tests, inventory traps and 80% Rule confirmation. A storm cap limits how many alerts fire per window. Note: a TradingView alert keeps the levels that were pasted when you created it, so re-create level alerts after pasting new levels. The other alerts update on their own.
WHAT IS ORIGINAL
- Volume profiles and naked POCs are built from 1-minute intrabar data, so they come out the same on any minute chart timeframe.
- Profile Row Scale (Auto) sizes profile rows to the symbol's price, so the same script loads on ES, NQ, CL, GC and other symbols without per-symbol settings.
- On continuous futures, the profiles switch to the new front contract once it out-trades the old one, instead of mixing two contracts' prices.
- The day type is classified live during the session from Dalton's criteria (IB width versus daily ATR, range extension, breaks of prior-day and overnight structure, value migration), not labeled after the close.
HOW TO USE
1. Use a minute chart on a CME futures symbol and load enough history for the profile period you pick. A yearly profile needs a long history.
2. Leave the session-time inputs at their defaults. They are CME exchange time (Central); set TradingView's chart timezone for local display instead. The script warns on the chart if a session input was changed.
3. Profile Row Scale "Auto" sizes profile rows, naked POC bins and single-print blocks to the symbol's price, so NQ gets larger rows than ES without a separate mode. Pick a fixed scale if a symbol loads slowly.
4. Turn sections on and off in the settings. Every section has its own lines, labels and alerts.
LIMITATIONS
- Profiles and naked POCs are built from 1-minute bars, so they approximate tick-level profiles.
- TradingView allows 500 lines, 500 boxes and 500 labels per script; the oldest drawings are removed first.
- On continuous contracts (for example ES1!), profiles switch to the new front contract once it out-trades the old one. During a roll week, TradingView's continuous symbol can still follow the expiring contract.
- This is an analysis tool. It does not predict prices and gives no trade signals or recommendations.
Open source under the Mozilla Public License 2.0.
It is built for CME futures (index, energy and metals) on minute charts. Every session time is CME exchange time (Central). The script gives no buy or sell signals and no trade recommendations.
WHY THESE PARTS ARE IN ONE SCRIPT
An auction read is one process, not a stack of separate indicators. Prior value shows where the market opened relative to fair price. The initial balance and range extension show whether that open is being accepted. Overnight inventory and the late-day spike show who may be forced to act. Naked POCs, single prints and poor highs and lows show what the auction left unfinished. Here the parts share one session clock, one tick and row-size engine and one dashboard, so their numbers agree, and the day-type read uses them together. Every part can be switched off on its own.
WHERE IS VALUE?
- Developing volume profile for the session, week (default), month or year, built from 1-minute bars, with POC, VAH and VAL (68% value area by default). Optional high-volume "walls" from the same profile.
- Prior-day POC, VAH and VAL from the RTH session.
- Prior-month POC, VAH, VAL, high and low.
- RTH VWAP anchored at the 8:30 CT open (off by default).
BALANCED OR TRENDING?
- Initial Balance (8:30-9:30 CT) with an optional midpoint.
- Day type, updated through the session from IB width versus daily ATR, range extension, breaks of prior-day and overnight structure, and value migration: Trend Day, Normal Day, Normal Variation, Neutral Day (center or extreme) or Non-Trend Day. Before the auction develops it shows Gap Up, Gap Down or Developing.
- Open location versus prior structure: above pdHigh, above pdVAH, inside value, below pdVAL or below pdLow.
- 80% Rule: when the session opens outside the prior day's value area, the value area is shaded. Once price has held inside it for 60 minutes, the setup is marked confirmed.
WHO IS TRAPPED?
- Overnight inventory: the share of overnight bars that traded above or below the prior settlement. When the whole overnight session sat on one side, the settlement line is marked as a trap and the day type shows TRAP.
- Late spike: the base of a breakout in the last 30 minutes of RTH (14:30-15:00 CT), with an alert when price comes back to test it.
WHAT IS UNFINISHED?
- Naked POCs (daily, weekly and monthly) that stay on the chart until price trades through them.
- Single prints from a 30-minute TPO profile of the RTH session, with tails filtered out.
- Poor highs and lows: a session extreme with two or more TPO periods at the same price.
WHICH REFERENCE PRICES MATTER?
- Overnight high and low (removed at 15:00 CT by default), previous day high and low, previous week high and low, previous month high and low, the weekly open (Sunday Globex) and the RTH open.
WHERE ARE MY LEVELS?
Paste your own levels into "Paste Levels Here" as one line: the date, the pivot, then any prices. Example:
2026-10-05, 5500.00, 5510.00, 5525.00, 5490.00, 5475.00
Prices above the pivot are drawn as resistance and prices below it as support, numbered outward from the pivot. Each level gets a zone sized by daily ATR or by ticks, flips color once price passes through it by a set ATR buffer, and can alert on crosses. The labeled form (Pivot Level / Resistance Levels / Support Levels lines) also works.
DASHBOARD
Session, day type, pivot bias (price versus your pasted pivot), overnight inventory, open location, daily ATR and ATR used, and 80% Rule status.
ALERTS
Optional alerts for crosses of your pasted levels, the IB, overnight high and low, RTH VWAP, prior-day high, low and value, prior-week and prior-month levels, the weekly open, and the developing POC, VAH and VAL, plus naked POC touches, spike-base tests, inventory traps and 80% Rule confirmation. A storm cap limits how many alerts fire per window. Note: a TradingView alert keeps the levels that were pasted when you created it, so re-create level alerts after pasting new levels. The other alerts update on their own.
WHAT IS ORIGINAL
- Volume profiles and naked POCs are built from 1-minute intrabar data, so they come out the same on any minute chart timeframe.
- Profile Row Scale (Auto) sizes profile rows to the symbol's price, so the same script loads on ES, NQ, CL, GC and other symbols without per-symbol settings.
- On continuous futures, the profiles switch to the new front contract once it out-trades the old one, instead of mixing two contracts' prices.
- The day type is classified live during the session from Dalton's criteria (IB width versus daily ATR, range extension, breaks of prior-day and overnight structure, value migration), not labeled after the close.
HOW TO USE
1. Use a minute chart on a CME futures symbol and load enough history for the profile period you pick. A yearly profile needs a long history.
2. Leave the session-time inputs at their defaults. They are CME exchange time (Central); set TradingView's chart timezone for local display instead. The script warns on the chart if a session input was changed.
3. Profile Row Scale "Auto" sizes profile rows, naked POC bins and single-print blocks to the symbol's price, so NQ gets larger rows than ES without a separate mode. Pick a fixed scale if a symbol loads slowly.
4. Turn sections on and off in the settings. Every section has its own lines, labels and alerts.
LIMITATIONS
- Profiles and naked POCs are built from 1-minute bars, so they approximate tick-level profiles.
- TradingView allows 500 lines, 500 boxes and 500 labels per script; the oldest drawings are removed first.
- On continuous contracts (for example ES1!), profiles switch to the new front contract once it out-trades the old one. During a roll week, TradingView's continuous symbol can still follow the expiring contract.
- This is an analysis tool. It does not predict prices and gives no trade signals or recommendations.
Open source under the Mozilla Public License 2.0.
Notes de version
Minor visual updateNotes de version
Levels now follow your chart's B-ADJ setting. With it off (the default), profiles, naked POCs and prior day/week/month levels use actual traded prices.
Clause de non-responsabilité
Les informations et publications ne sont pas destinées à être, et ne constituent pas, des conseils ou recommandations financiers, d'investissement, de trading ou autres fournis ou approuvés par TradingView. Pour en savoir plus, consultez les Conditions d'utilisation.
Clause de non-responsabilité
Les informations et publications ne sont pas destinées à être, et ne constituent pas, des conseils ou recommandations financiers, d'investissement, de trading ou autres fournis ou approuvés par TradingView. Pour en savoir plus, consultez les Conditions d'utilisation.