Artillery Trendline Break and Bounce
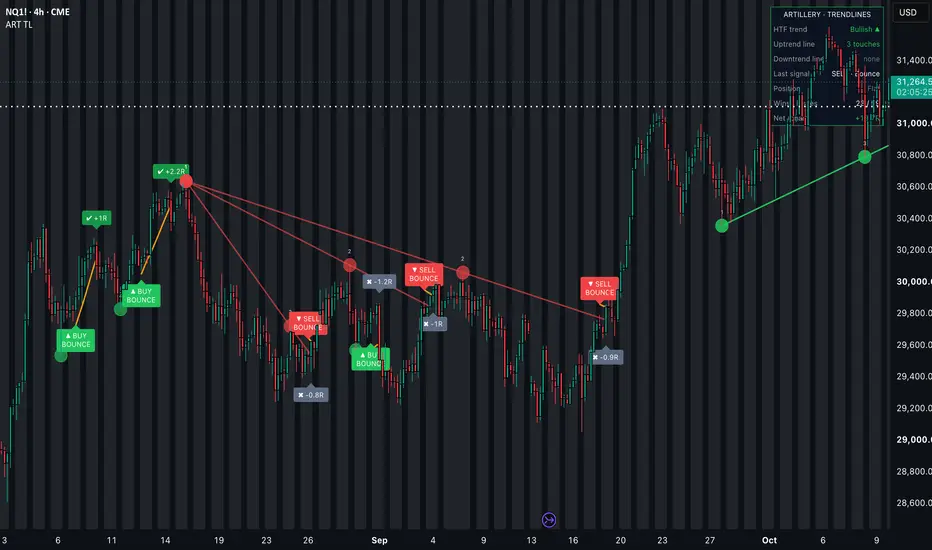
Artillery Trendline Break and Bounce draws trendlines automatically from confirmed swing points and marks two classic trendline setups on the chart: the bounce off a respected line, and the break of a line close to a protective "safety line". It is built around the trendline method taught publicly by Tori Trades (not affiliated), turned into objective rules so every step is visible.
HOW IT WORKS
1. Trendlines: swing highs and lows are confirmed after a set number of bars on each side (default 5). An uptrend line connects two higher lows, a downtrend line connects two lower highs. A line is only drawn if no candle has closed through it since its first point, and the version with the most touches (then the longest span) is chosen. Each touch is numbered on the chart.
2. Bounce setup: when price tests an established line (default: at least 30 bars from its first point, about one week of 4H candles) and the candle closes back in the trend direction, a BOUNCE signal prints. The stop sits beyond the line plus a small ATR buffer and trails along the line as it moves.
3. Break setup: when a candle closes through a line, a BREAK signal prints only if price is still close to the most recent swing on the other side (within 1.5 × ATR by default). That swing is the "safety line" stop. It trails to each new confirmed swing as the move develops.
4. Exits: there is no fixed target. A trade closes when a candle closes through its safety line, and the result is tagged in R (multiples of the initial risk).
5. Trend filter (optional, on by default): signals are only taken in the direction of a higher-timeframe EMA (default Daily EMA 50), following a top-down approach.
ON THE CHART
• Green uptrend lines and red downtrend lines with numbered touches
• BUY / SELL tags for BOUNCE and BREAK setups
• Orange safety-line stop while a trade is open
• Result tags in R when a trade closes
• Dashboard: higher-timeframe trend, active lines and touches, last signal, position, wins/losses and net R
• Alerts for every signal and for safety-line exits
HOW TO USE
Designed for the 4H chart with the Daily as the trend reference, on index futures, metals, energy, forex or crypto. Swing length, touch tolerance, minimum line age, break distance, stop buffer and the trend filter can all be adjusted. Lines that never produced a signal are removed when they break to keep the chart clean.
NOTES
• Swings confirm after the swing length and higher-timeframe data uses confirmed values, so signals do not repaint.
• The method takes many small losses and relies on fewer, larger trend moves. The wins/losses and R shown in the dashboard only cover bars loaded on your chart; they are not a backtest and do not predict future results.
• For educational purposes only. Not financial advice.
HOW IT WORKS
1. Trendlines: swing highs and lows are confirmed after a set number of bars on each side (default 5). An uptrend line connects two higher lows, a downtrend line connects two lower highs. A line is only drawn if no candle has closed through it since its first point, and the version with the most touches (then the longest span) is chosen. Each touch is numbered on the chart.
2. Bounce setup: when price tests an established line (default: at least 30 bars from its first point, about one week of 4H candles) and the candle closes back in the trend direction, a BOUNCE signal prints. The stop sits beyond the line plus a small ATR buffer and trails along the line as it moves.
3. Break setup: when a candle closes through a line, a BREAK signal prints only if price is still close to the most recent swing on the other side (within 1.5 × ATR by default). That swing is the "safety line" stop. It trails to each new confirmed swing as the move develops.
4. Exits: there is no fixed target. A trade closes when a candle closes through its safety line, and the result is tagged in R (multiples of the initial risk).
5. Trend filter (optional, on by default): signals are only taken in the direction of a higher-timeframe EMA (default Daily EMA 50), following a top-down approach.
ON THE CHART
• Green uptrend lines and red downtrend lines with numbered touches
• BUY / SELL tags for BOUNCE and BREAK setups
• Orange safety-line stop while a trade is open
• Result tags in R when a trade closes
• Dashboard: higher-timeframe trend, active lines and touches, last signal, position, wins/losses and net R
• Alerts for every signal and for safety-line exits
HOW TO USE
Designed for the 4H chart with the Daily as the trend reference, on index futures, metals, energy, forex or crypto. Swing length, touch tolerance, minimum line age, break distance, stop buffer and the trend filter can all be adjusted. Lines that never produced a signal are removed when they break to keep the chart clean.
NOTES
• Swings confirm after the swing length and higher-timeframe data uses confirmed values, so signals do not repaint.
• The method takes many small losses and relies on fewer, larger trend moves. The wins/losses and R shown in the dashboard only cover bars loaded on your chart; they are not a backtest and do not predict future results.
• For educational purposes only. Not financial advice.

Clause de non-responsabilité
Les informations et publications ne sont pas destinées à être, et ne constituent pas, des conseils ou recommandations financiers, d'investissement, de trading ou autres fournis ou approuvés par TradingView. Pour en savoir plus, consultez les Conditions d'utilisation.
Clause de non-responsabilité
Les informations et publications ne sont pas destinées à être, et ne constituent pas, des conseils ou recommandations financiers, d'investissement, de trading ou autres fournis ou approuvés par TradingView. Pour en savoir plus, consultez les Conditions d'utilisation.