OPEN-SOURCE SCRIPT
Poor trend[ALT_analyst]
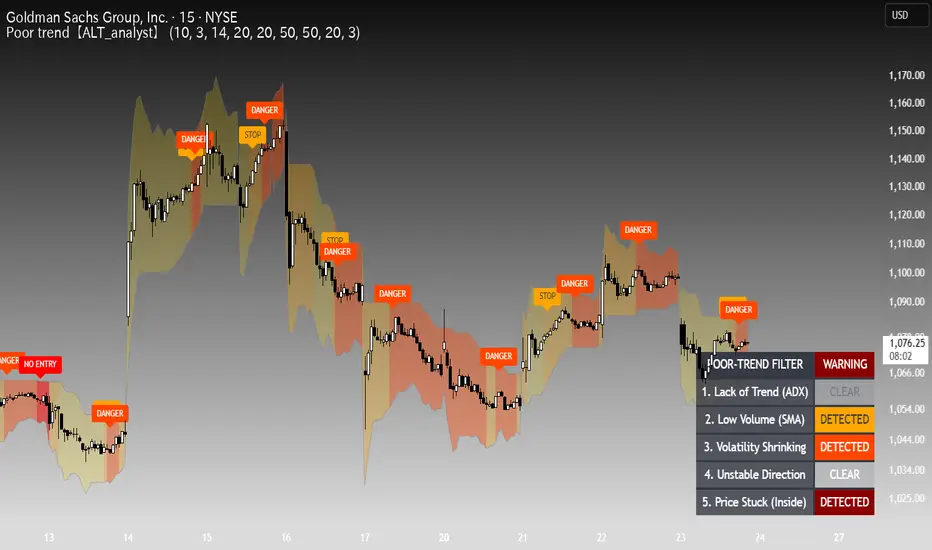
Poor trend [ALT_analyst]
ATTENTION: This script is STRICTLY for market environment recognition (Regime Filter). It does NOT provide entry signals or trading recommendations.
■Overview
This indicator, "Poor trend [ALT_analyst]", is an administrative filter designed not to search for entry signals, but to logically validate and enforce the decision to "take no position."
In directional trading, significant drawdowns occur during low-quality, trendless environments. This script continuously quantifies market stagnation across five independent modules. By mathematically demonstrating the degradation of a directional edge, it provides an objective baseline to suppress unnecessary entries and avoid whipsaw losses.
■Mathematical Proof of Edge Degradation in "Poor Trends"
The mathematical edge of a directional strategy is governed by the Expected Value equation:
Expected Value = (Win Probability * Average Win) - (Loss Probability * Average Loss)
For directional trading (trend-following or breakout), a "Poor Trend" mathematically degrades this equation. When market action exhibits low volatility, restricted ranges, and low liquidity, the probability of a directional breakout (Win Probability) decreases. Simultaneously, the shrinking ATR compresses the potential profit margin (Average Win). As the Average Win approaches transaction costs (spread/commission) and the Win Probability drops, the Expected Value strictly converges toward a negative figure. This script objectively flags the exact parameters where this mathematical degradation occurs.
5 Danger Detection Modules (Calculation Logic & Output Examples)
The script evaluates five independent conditions to calculate a total "Danger Score" (0 to 5).
1. Lack of Trend (ADX)
Calculation Logic:
Pine Script®
Why this calculation: The Average Directional Index (ADX) measures absolute trend strength. A value below 20 statistically demonstrates that price action is dominated by noise rather than a directional vector, lowering the Win Probability.
Actual Output Example: If the current ADX value is 15.5, the logic evaluates 15.5 < 20. This returns true (Boolean), adding 1 to the Danger Score.
2. Low Volume (SMA)
Calculation Logic:
Pine Script®
Why this calculation: Compares short-term versus long-term volume averages. A drop in short-term volume detects liquidity withdrawal from the market, mathematically increasing slippage risks and transaction costs.
Actual Output Example: If the 20-period SMA volume is 1,200 and the 50-period SMA is 1,500, the logic evaluates 1200 < 1500. This returns true, adding 1 to the Danger Score.
3. Volatility Shrinking (Z-Score)
Calculation Logic:
Pine Script®
Why this calculation: Standardizes the current ATR band width against its 50-period history using a Z-score. A negative Z-score proves statistical volatility compression, severely limiting the Average Win potential.
Actual Output Example: If the current band width is 10, the 50-period mean is 15, and the standard deviation is 5. The Z-score is (10 - 15) / 5 = -1.0. Since -1.0 < 0.0, it returns true, adding 1 to the Danger Score.
4. Unstable Direction (Whipsaw)
Calculation Logic: flip_count >= whip_threshold (Default: 3)
Why this calculation: Counts how many times the Supertrend direction has flipped over the last 20 periods. Frequent flips empirically prove directional instability and high whipsaw risk.
Actual Output Example: If the Supertrend has changed direction 4 times within the last 20 bars, the logic evaluates 4 >= 3. This returns true, adding 1 to the Danger Score.
5. Price Stuck (Trapped Inside Bands)
Calculation Logic:
Pine Script®
Why this calculation: Confirms both the high and low of the current candle are completely confined within the ATR boundaries. This proves zero momentum exists to break statistical limits.
Actual Output Example: If the Upper Band is 110, Lower Band is 90, Candle High is 105, and Candle Low is 95. The logic evaluates (105 < 110) and (95 > 90). Both are true, returning true, adding 1 to the Danger Score.
■Visual & UI Specifications
Danger Ribbon: The space between the Normal and Inverse lines fills with color based on the Danger Score (1: Yellow to 5: Dark Red). A score of 0 ("PEACE") renders the ribbon fully transparent.
Sparse Labels: To eliminate chart clutter, status labels ("WAIT", "STOP", "MAX DANGER") are strictly plotted only on the exact bar where the Danger Score increases or resets to 0.
Dashboard Table: A real-time matrix at the bottom right displays the precise binary status ("DETECTED" or "CLEAR") of all 5 modules, providing instantaneous administrative clarity on market conditions.
■Operating Policy
When the Danger Score is active (Ribbon is colored, modules are DETECTED), the statistical Expected Value for directional trading is compromised. Utilize this indicator strictly as an objective administrative filter to halt new entries and justify capital preservation.
Disclaimer
The information and scripts provided in this publication are for educational and informational purposes only. They do not constitute financial, investment, or trading advice. Trading in financial markets involves a high degree of risk, and you may lose some or all of your capital. Past performance is not necessarily indicative of future results. The author assumes no responsibility or liability for any trading losses incurred as a result of using this script. Please conduct your own due diligence and make trading decisions at your own risk.
ATTENTION: This script is STRICTLY for market environment recognition (Regime Filter). It does NOT provide entry signals or trading recommendations.
■Overview
This indicator, "Poor trend [ALT_analyst]", is an administrative filter designed not to search for entry signals, but to logically validate and enforce the decision to "take no position."
In directional trading, significant drawdowns occur during low-quality, trendless environments. This script continuously quantifies market stagnation across five independent modules. By mathematically demonstrating the degradation of a directional edge, it provides an objective baseline to suppress unnecessary entries and avoid whipsaw losses.
■Mathematical Proof of Edge Degradation in "Poor Trends"
The mathematical edge of a directional strategy is governed by the Expected Value equation:
Expected Value = (Win Probability * Average Win) - (Loss Probability * Average Loss)
For directional trading (trend-following or breakout), a "Poor Trend" mathematically degrades this equation. When market action exhibits low volatility, restricted ranges, and low liquidity, the probability of a directional breakout (Win Probability) decreases. Simultaneously, the shrinking ATR compresses the potential profit margin (Average Win). As the Average Win approaches transaction costs (spread/commission) and the Win Probability drops, the Expected Value strictly converges toward a negative figure. This script objectively flags the exact parameters where this mathematical degradation occurs.
5 Danger Detection Modules (Calculation Logic & Output Examples)
The script evaluates five independent conditions to calculate a total "Danger Score" (0 to 5).
1. Lack of Trend (ADX)
Calculation Logic:
Why this calculation: The Average Directional Index (ADX) measures absolute trend strength. A value below 20 statistically demonstrates that price action is dominated by noise rather than a directional vector, lowering the Win Probability.
Actual Output Example: If the current ADX value is 15.5, the logic evaluates 15.5 < 20. This returns true (Boolean), adding 1 to the Danger Score.
2. Low Volume (SMA)
Calculation Logic:
Why this calculation: Compares short-term versus long-term volume averages. A drop in short-term volume detects liquidity withdrawal from the market, mathematically increasing slippage risks and transaction costs.
Actual Output Example: If the 20-period SMA volume is 1,200 and the 50-period SMA is 1,500, the logic evaluates 1200 < 1500. This returns true, adding 1 to the Danger Score.
3. Volatility Shrinking (Z-Score)
Calculation Logic:
Why this calculation: Standardizes the current ATR band width against its 50-period history using a Z-score. A negative Z-score proves statistical volatility compression, severely limiting the Average Win potential.
Actual Output Example: If the current band width is 10, the 50-period mean is 15, and the standard deviation is 5. The Z-score is (10 - 15) / 5 = -1.0. Since -1.0 < 0.0, it returns true, adding 1 to the Danger Score.
4. Unstable Direction (Whipsaw)
Calculation Logic: flip_count >= whip_threshold (Default: 3)
Why this calculation: Counts how many times the Supertrend direction has flipped over the last 20 periods. Frequent flips empirically prove directional instability and high whipsaw risk.
Actual Output Example: If the Supertrend has changed direction 4 times within the last 20 bars, the logic evaluates 4 >= 3. This returns true, adding 1 to the Danger Score.
5. Price Stuck (Trapped Inside Bands)
Calculation Logic:
Why this calculation: Confirms both the high and low of the current candle are completely confined within the ATR boundaries. This proves zero momentum exists to break statistical limits.
Actual Output Example: If the Upper Band is 110, Lower Band is 90, Candle High is 105, and Candle Low is 95. The logic evaluates (105 < 110) and (95 > 90). Both are true, returning true, adding 1 to the Danger Score.
■Visual & UI Specifications
Danger Ribbon: The space between the Normal and Inverse lines fills with color based on the Danger Score (1: Yellow to 5: Dark Red). A score of 0 ("PEACE") renders the ribbon fully transparent.
Sparse Labels: To eliminate chart clutter, status labels ("WAIT", "STOP", "MAX DANGER") are strictly plotted only on the exact bar where the Danger Score increases or resets to 0.
Dashboard Table: A real-time matrix at the bottom right displays the precise binary status ("DETECTED" or "CLEAR") of all 5 modules, providing instantaneous administrative clarity on market conditions.
■Operating Policy
When the Danger Score is active (Ribbon is colored, modules are DETECTED), the statistical Expected Value for directional trading is compromised. Utilize this indicator strictly as an objective administrative filter to halt new entries and justify capital preservation.
Disclaimer
The information and scripts provided in this publication are for educational and informational purposes only. They do not constitute financial, investment, or trading advice. Trading in financial markets involves a high degree of risk, and you may lose some or all of your capital. Past performance is not necessarily indicative of future results. The author assumes no responsibility or liability for any trading losses incurred as a result of using this script. Please conduct your own due diligence and make trading decisions at your own risk.
Script open-source
Dans l'esprit TradingView, le créateur de ce script l'a rendu open source afin que les traders puissent examiner et vérifier ses fonctionnalités. Bravo à l'auteur! Bien que vous puissiez l'utiliser gratuitement, n'oubliez pas que la republication du code est soumise à nos Règles.

Script Developer.
I specialize in pushing basic, fundamental concepts to their absolute limits. Dedicated to engineering noise-free indicators that reveal true market mechanics and logical edges. Clarity over https://clutter.https://www.youtube.com/@alt.analyst
I specialize in pushing basic, fundamental concepts to their absolute limits. Dedicated to engineering noise-free indicators that reveal true market mechanics and logical edges. Clarity over https://clutter.https://www.youtube.com/@alt.analyst
Clause de non-responsabilité
Les informations et publications ne sont pas destinées à être, et ne constituent pas, des conseils ou recommandations financiers, d'investissement, de trading ou autres fournis ou approuvés par TradingView. Pour en savoir plus, consultez les Conditions d'utilisation.
Script open-source
Dans l'esprit TradingView, le créateur de ce script l'a rendu open source afin que les traders puissent examiner et vérifier ses fonctionnalités. Bravo à l'auteur! Bien que vous puissiez l'utiliser gratuitement, n'oubliez pas que la republication du code est soumise à nos Règles.
Script Developer.
I specialize in pushing basic, fundamental concepts to their absolute limits. Dedicated to engineering noise-free indicators that reveal true market mechanics and logical edges. Clarity over https://clutter.https://www.youtube.com/@alt.analyst
I specialize in pushing basic, fundamental concepts to their absolute limits. Dedicated to engineering noise-free indicators that reveal true market mechanics and logical edges. Clarity over https://clutter.https://www.youtube.com/@alt.analyst
Clause de non-responsabilité
Les informations et publications ne sont pas destinées à être, et ne constituent pas, des conseils ou recommandations financiers, d'investissement, de trading ou autres fournis ou approuvés par TradingView. Pour en savoir plus, consultez les Conditions d'utilisation.