Soul Investor | Trend Structure & YTD
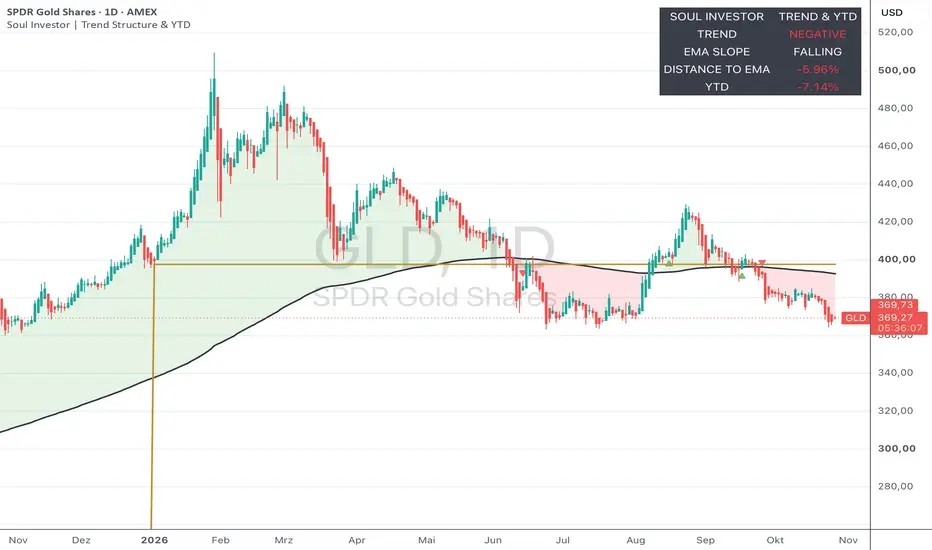
# Soul Investor | Trend Structure & YTD
**Long-Term Trend Analysis, EMA Momentum & Year-to-Date Performance**
## Overview
Soul Investor | Trend Structure & YTD is a technical analysis indicator designed to provide a structured overview of long-term market trends, trend transitions and year-to-date price performance.
The indicator combines a 200-period Exponential Moving Average (EMA), moving-average slope analysis, visual trend classification and a previous-year closing-price reference.
Its purpose is to help traders and investors interpret price behavior within a consistent technical framework.
## Key Features
**1. Long-Term Trend Structure**
The indicator uses a 200-period EMA to evaluate the relationship between price and the long-term moving average.
Three visual trend conditions are displayed:
- **Green:** Price is above the EMA 200 and the moving average is rising.
- **Red:** Price is below the EMA 200 and the moving average is falling.
- **Gray:** Price position and EMA slope do not confirm the same directional trend.
The colored area between price and the EMA provides a visual representation of these conditions.
**2. EMA Slope Analysis**
The indicator evaluates the direction of the EMA by comparing its current value with its value a configurable number of periods earlier.
This additional condition helps distinguish between price movements above or below the moving average and trend conditions supported by the direction of the average itself.
**3. Trend Transition Signals**
Small green and red triangles identify transitions into confirmed positive or negative trend conditions.
These markers indicate changes in the indicator's trend classification. They are not independent buy or sell recommendations.
Optional TradingView alert conditions are included for these transitions.
**4. Year-to-Date Reference**
A gold horizontal line represents the closing price of the final trading day of the previous calendar year.
This reference provides a visual comparison between the current market price and the previous year-end closing level.
The YTD percentage measures price performance relative to that reference.
**5. Trend Dashboard**
A compact dashboard displays four analytical measurements:
- **Trend:** Positive, Negative or Transition
- **EMA Slope:** Rising, Falling or Flat
- **Distance to EMA:** Percentage difference between the current price and the EMA
- **YTD:** Percentage price change since the previous year-end closing price
## Calculation Methodology
The EMA is calculated using TradingView's standard exponential moving average function.
Trend classification combines two conditions: the position of the closing price relative to the EMA and the direction of the EMA over the selected lookback period.
A positive trend requires both price above the EMA and a rising EMA. A negative trend requires price below the EMA and a falling EMA. All other combinations are classified as transitional.
YTD performance is calculated as:
**YTD (%) = (Current Price / Previous Year-End Close − 1) × 100**
## Recommended Chart Settings
The indicator is primarily designed for daily charts with a one-year viewing window.
Default settings:
- EMA Period: 200
- EMA Slope Lookback: 10 trading periods
- Chart Interval: Daily (1D)
- Viewing Window: 1 Year
Users may adjust the available settings according to their analytical preferences.
## Interpretation and Limitations
Moving averages are lagging technical indicators. Trend classifications may change frequently during sideways or volatile market conditions.
The distance from the EMA measures price deviation, not intrinsic valuation or investment attractiveness.
YTD performance reflects price changes and does not necessarily include dividends, distributions or other components of total return.
The indicator does not predict future prices or guarantee trading outcomes.
## About Soul Investor
Developed by **Soul Investor Academy**, combining structured investment analysis with a long-term perspective on financial markets.
*For educational and informational purposes only. This indicator does not constitute investment advice or a recommendation to buy or sell financial instruments.*
**Long-Term Trend Analysis, EMA Momentum & Year-to-Date Performance**
## Overview
Soul Investor | Trend Structure & YTD is a technical analysis indicator designed to provide a structured overview of long-term market trends, trend transitions and year-to-date price performance.
The indicator combines a 200-period Exponential Moving Average (EMA), moving-average slope analysis, visual trend classification and a previous-year closing-price reference.
Its purpose is to help traders and investors interpret price behavior within a consistent technical framework.
## Key Features
**1. Long-Term Trend Structure**
The indicator uses a 200-period EMA to evaluate the relationship between price and the long-term moving average.
Three visual trend conditions are displayed:
- **Green:** Price is above the EMA 200 and the moving average is rising.
- **Red:** Price is below the EMA 200 and the moving average is falling.
- **Gray:** Price position and EMA slope do not confirm the same directional trend.
The colored area between price and the EMA provides a visual representation of these conditions.
**2. EMA Slope Analysis**
The indicator evaluates the direction of the EMA by comparing its current value with its value a configurable number of periods earlier.
This additional condition helps distinguish between price movements above or below the moving average and trend conditions supported by the direction of the average itself.
**3. Trend Transition Signals**
Small green and red triangles identify transitions into confirmed positive or negative trend conditions.
These markers indicate changes in the indicator's trend classification. They are not independent buy or sell recommendations.
Optional TradingView alert conditions are included for these transitions.
**4. Year-to-Date Reference**
A gold horizontal line represents the closing price of the final trading day of the previous calendar year.
This reference provides a visual comparison between the current market price and the previous year-end closing level.
The YTD percentage measures price performance relative to that reference.
**5. Trend Dashboard**
A compact dashboard displays four analytical measurements:
- **Trend:** Positive, Negative or Transition
- **EMA Slope:** Rising, Falling or Flat
- **Distance to EMA:** Percentage difference between the current price and the EMA
- **YTD:** Percentage price change since the previous year-end closing price
## Calculation Methodology
The EMA is calculated using TradingView's standard exponential moving average function.
Trend classification combines two conditions: the position of the closing price relative to the EMA and the direction of the EMA over the selected lookback period.
A positive trend requires both price above the EMA and a rising EMA. A negative trend requires price below the EMA and a falling EMA. All other combinations are classified as transitional.
YTD performance is calculated as:
**YTD (%) = (Current Price / Previous Year-End Close − 1) × 100**
## Recommended Chart Settings
The indicator is primarily designed for daily charts with a one-year viewing window.
Default settings:
- EMA Period: 200
- EMA Slope Lookback: 10 trading periods
- Chart Interval: Daily (1D)
- Viewing Window: 1 Year
Users may adjust the available settings according to their analytical preferences.
## Interpretation and Limitations
Moving averages are lagging technical indicators. Trend classifications may change frequently during sideways or volatile market conditions.
The distance from the EMA measures price deviation, not intrinsic valuation or investment attractiveness.
YTD performance reflects price changes and does not necessarily include dividends, distributions or other components of total return.
The indicator does not predict future prices or guarantee trading outcomes.
## About Soul Investor
Developed by **Soul Investor Academy**, combining structured investment analysis with a long-term perspective on financial markets.
*For educational and informational purposes only. This indicator does not constitute investment advice or a recommendation to buy or sell financial instruments.*

Clause de non-responsabilité
Les informations et publications ne sont pas destinées à être, et ne constituent pas, des conseils ou recommandations financiers, d'investissement, de trading ou autres fournis ou approuvés par TradingView. Pour en savoir plus, consultez les Conditions d'utilisation.
Clause de non-responsabilité
Les informations et publications ne sont pas destinées à être, et ne constituent pas, des conseils ou recommandations financiers, d'investissement, de trading ou autres fournis ou approuvés par TradingView. Pour en savoir plus, consultez les Conditions d'utilisation.