Mis à jour
Seasonality (10Y vs 20Y Swing)
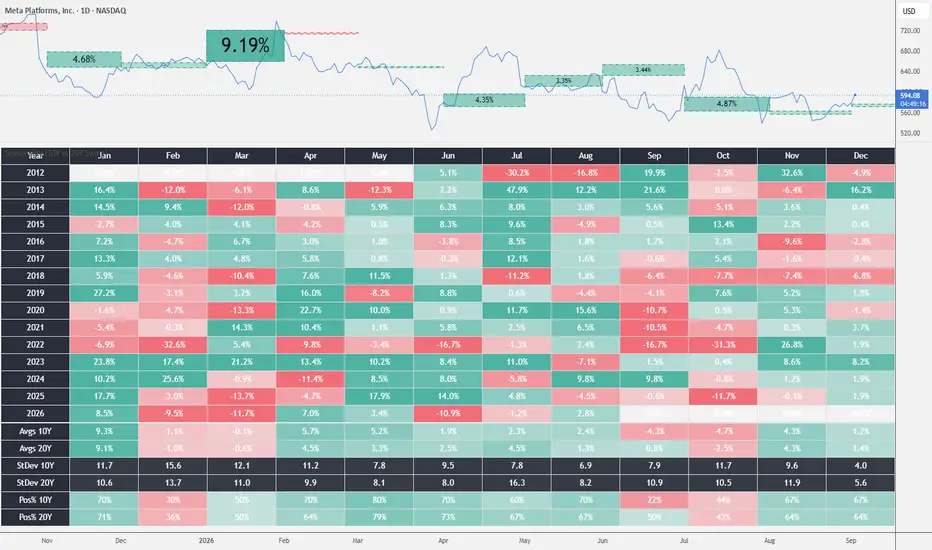
Introducing Seasonality (10Y vs 20Y Swing), a professional-grade indicator designed to analyze monthly seasonal behavior across a dual 10-year and 20-year analytical window.
Unlike traditional seasonal heatmaps that lump all historical data together statically, this script segments core metrics to evaluate how market cycles evolve across medium and long-term horizons.
⚙️ Key Features:
- Dynamic Heatmap Matrix: Visualizes year-by-year percentage returns for every month, featuring an adaptive color gradient driven by custom cutoff thresholds.
- 10Y vs 20Y Segmentation: Calculates independent comparative metrics across three critical dimensions:
- Avgs (Averages): Expected average return per month.
- StDev (Standard Deviation): Historical dispersion and volatility measurement for the period.
- Pos% (Percent Positive): Statistical reliability of the month closing in positive territory.
- Chart Projections (Boxes & Plots): Automatically plots seasonal range boxes for the active month (Expected price for current month) derived from historical averages, supporting data window metrics and main chart overlays (force_overlay = true).
- Exception Filter: Allows the exclusion of outlier months or structural anomalies via a straightforward text input format (YYYY-MM).
💡 How to Use It:
- Add the indicator to your chart (optimized for the 1M timeframe to feed historical calculations accurately).
- Inspect the bottom-anchored Heatmap to pinpoint recurring bullish or bearish seasonal tendencies.
- Use the current month's projection lines to benchmark live price action against expected seasonal behavior.
Unlike traditional seasonal heatmaps that lump all historical data together statically, this script segments core metrics to evaluate how market cycles evolve across medium and long-term horizons.
⚙️ Key Features:
- Dynamic Heatmap Matrix: Visualizes year-by-year percentage returns for every month, featuring an adaptive color gradient driven by custom cutoff thresholds.
- 10Y vs 20Y Segmentation: Calculates independent comparative metrics across three critical dimensions:
- Avgs (Averages): Expected average return per month.
- StDev (Standard Deviation): Historical dispersion and volatility measurement for the period.
- Pos% (Percent Positive): Statistical reliability of the month closing in positive territory.
- Chart Projections (Boxes & Plots): Automatically plots seasonal range boxes for the active month (Expected price for current month) derived from historical averages, supporting data window metrics and main chart overlays (force_overlay = true).
- Exception Filter: Allows the exclusion of outlier months or structural anomalies via a straightforward text input format (YYYY-MM).
💡 How to Use It:
- Add the indicator to your chart (optimized for the 1M timeframe to feed historical calculations accurately).
- Inspect the bottom-anchored Heatmap to pinpoint recurring bullish or bearish seasonal tendencies.
- Use the current month's projection lines to benchmark live price action against expected seasonal behavior.
Notes de version
Minor errors fixed
Clause de non-responsabilité
Les informations et publications ne sont pas destinées à être, et ne constituent pas, des conseils ou recommandations financiers, d'investissement, de trading ou autres fournis ou approuvés par TradingView. Pour en savoir plus, consultez les Conditions d'utilisation.
Clause de non-responsabilité
Les informations et publications ne sont pas destinées à être, et ne constituent pas, des conseils ou recommandations financiers, d'investissement, de trading ou autres fournis ou approuvés par TradingView. Pour en savoir plus, consultez les Conditions d'utilisation.