OPEN-SOURCE SCRIPT
Mis à jour ADR Dashboard with Move, Left and Alerts
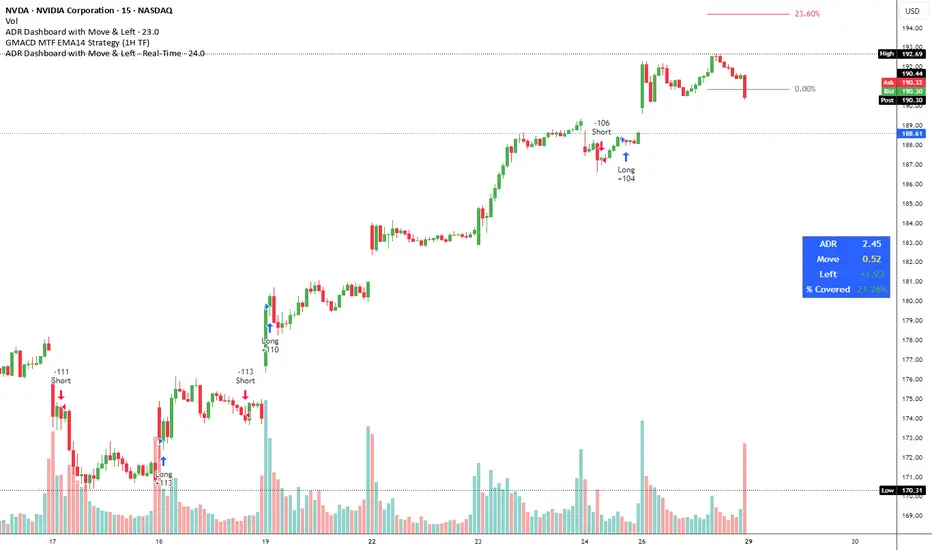
Indicator Name: ADR Dashboard with Move, Left and Alerts
Overview
The ADR Dashboard is a powerful real-time trading tool that tracks how much a stock, crypto, or other asset has moved today relative to its Average Daily Range (ADR). It provides a clear visual representation of:
1. Today’s price movement (Move)
2. Remaining potential movement left to reach ADR (Left)
3. Percentage of ADR covered (% Covered)
4.Additionally, it provides automated alerts for key movement thresholds.
A) What it Does
1.Calculates the Average Daily Range (ADR):
2. Uses True Range over a user-defined lookback period (default 14 days).
3. ADR measures typical daily volatility.
B) Tracks Today’s Move:
1. Move = Current Price – Today’s Open (Realtime)
2. Positive → bullish move, Negative → bearish move
C) Tracks Remaining Potential (Left):
1. Left = ADR – |Move| (Realtime)
2. Shows how much of the ADR is still available for today’s move
3. Percentage Covered:
4. % Covered = |Move| / ADR × 100
D) Color-coded for visual clarity:
1. Green (<50%) → small move, plenty of range left
2. Yellow (50–80%) → moderate move, watch for acceleration
3. Orange (80–100%) → strong move, ADR almost reached
4. Red (>100%) → ADR exceeded, momentum may be exhausted
E) Dashboard Table:
1. Columns: ADR | Move | Left | % Covered
2. Position: middle-right of the chart
F) Left column color-coded:
1. Green → some ADR left
2. Red → ADR fully reached or exceeded
3. Move column: usually yellow for visibility, but could be enhanced for positive/negative moves
G) Alerts
The indicator provides directional alerts:
Bullish Alerts (upward moves):
1. 90% ADR warning: fires when Move ≥ 90% of ADR → early warning of strong bullish momentum
2. 100% ADR breach: fires when Move ≥ ADR → full daily range reached
Bearish Alerts (downward moves):
1. 90% ADR warning: fires when Move ≤ -90% of ADR → early warning of strong bearish momentum
2. 100% ADR breach: fires when Move ≤ -ADR → full daily range reached
All alerts are unique and fire once per session per threshold.
H) How Traders Can Use This Indicator
Momentum Trading:
1. Identify strong intraday moves approaching ADR.
2. Enter positions early at 90% ADR warning or take profits near 100% ADR.
Scalping & Intraday Trading:
1. Gauge how much of today’s range is left for quick entries/exits.
2. Avoid trades when ADR is almost fully consumed → reduces risk of reversals.
Swing Trading:
1. Combine with trend indicators to see if today’s move is significant relative to historical volatility.
I) Risk Management:
1. Set profit targets or stop-loss levels based on Move and Left values.
Visual Efficiency:
At-a-glance view of Move, Left, % Covered, and alert status without manual calculations.
Key Features
1. Real-time Move and Left updates
2. Color-coded % Covered and Left for quick visualization
3. Alerts for 90% and 100% ADR levels, bullish and bearish
4. Clean dashboard table at middle-right of the chart
5. Works across stocks, crypto, forex, and other markets
J) Why This Indicator is Powerful
1. Combines volatility (ADR) with real-time price tracking
2. Provides visual clarity and actionable alerts
3. Helps traders stay ahead of intraday moves, manage risk, and time entries/exits effectively
Overview
The ADR Dashboard is a powerful real-time trading tool that tracks how much a stock, crypto, or other asset has moved today relative to its Average Daily Range (ADR). It provides a clear visual representation of:
1. Today’s price movement (Move)
2. Remaining potential movement left to reach ADR (Left)
3. Percentage of ADR covered (% Covered)
4.Additionally, it provides automated alerts for key movement thresholds.
A) What it Does
1.Calculates the Average Daily Range (ADR):
2. Uses True Range over a user-defined lookback period (default 14 days).
3. ADR measures typical daily volatility.
B) Tracks Today’s Move:
1. Move = Current Price – Today’s Open (Realtime)
2. Positive → bullish move, Negative → bearish move
C) Tracks Remaining Potential (Left):
1. Left = ADR – |Move| (Realtime)
2. Shows how much of the ADR is still available for today’s move
3. Percentage Covered:
4. % Covered = |Move| / ADR × 100
D) Color-coded for visual clarity:
1. Green (<50%) → small move, plenty of range left
2. Yellow (50–80%) → moderate move, watch for acceleration
3. Orange (80–100%) → strong move, ADR almost reached
4. Red (>100%) → ADR exceeded, momentum may be exhausted
E) Dashboard Table:
1. Columns: ADR | Move | Left | % Covered
2. Position: middle-right of the chart
F) Left column color-coded:
1. Green → some ADR left
2. Red → ADR fully reached or exceeded
3. Move column: usually yellow for visibility, but could be enhanced for positive/negative moves
G) Alerts
The indicator provides directional alerts:
Bullish Alerts (upward moves):
1. 90% ADR warning: fires when Move ≥ 90% of ADR → early warning of strong bullish momentum
2. 100% ADR breach: fires when Move ≥ ADR → full daily range reached
Bearish Alerts (downward moves):
1. 90% ADR warning: fires when Move ≤ -90% of ADR → early warning of strong bearish momentum
2. 100% ADR breach: fires when Move ≤ -ADR → full daily range reached
All alerts are unique and fire once per session per threshold.
H) How Traders Can Use This Indicator
Momentum Trading:
1. Identify strong intraday moves approaching ADR.
2. Enter positions early at 90% ADR warning or take profits near 100% ADR.
Scalping & Intraday Trading:
1. Gauge how much of today’s range is left for quick entries/exits.
2. Avoid trades when ADR is almost fully consumed → reduces risk of reversals.
Swing Trading:
1. Combine with trend indicators to see if today’s move is significant relative to historical volatility.
I) Risk Management:
1. Set profit targets or stop-loss levels based on Move and Left values.
Visual Efficiency:
At-a-glance view of Move, Left, % Covered, and alert status without manual calculations.
Key Features
1. Real-time Move and Left updates
2. Color-coded % Covered and Left for quick visualization
3. Alerts for 90% and 100% ADR levels, bullish and bearish
4. Clean dashboard table at middle-right of the chart
5. Works across stocks, crypto, forex, and other markets
J) Why This Indicator is Powerful
1. Combines volatility (ADR) with real-time price tracking
2. Provides visual clarity and actionable alerts
3. Helps traders stay ahead of intraday moves, manage risk, and time entries/exits effectively
Notes de version
Updated versionScript open-source
Dans l'esprit TradingView, le créateur de ce script l'a rendu open source afin que les traders puissent examiner et vérifier ses fonctionnalités. Bravo à l'auteur! Bien que vous puissiez l'utiliser gratuitement, n'oubliez pas que la republication du code est soumise à nos Règles.

Clause de non-responsabilité
Les informations et publications ne sont pas destinées à être, et ne constituent pas, des conseils ou recommandations financiers, d'investissement, de trading ou autres fournis ou approuvés par TradingView. Pour en savoir plus, consultez les Conditions d'utilisation.
Script open-source
Dans l'esprit TradingView, le créateur de ce script l'a rendu open source afin que les traders puissent examiner et vérifier ses fonctionnalités. Bravo à l'auteur! Bien que vous puissiez l'utiliser gratuitement, n'oubliez pas que la republication du code est soumise à nos Règles.
Clause de non-responsabilité
Les informations et publications ne sont pas destinées à être, et ne constituent pas, des conseils ou recommandations financiers, d'investissement, de trading ou autres fournis ou approuvés par TradingView. Pour en savoir plus, consultez les Conditions d'utilisation.