OPEN-SOURCE SCRIPT
Mis à jour Parabolic Move Detector [AGPro Series]
🚀 Parabolic Move Detector [AGPro Series]
A dedicated framework for identifying, measuring, and classifying parabolic price acceleration across any asset and any timeframe. Built on a single transparent metric — Parabolic Pace — the tool objectively detects the start bar of a parabolic move, tracks its age, scores its intensity on a 0-100 scale, classifies its lifecycle phase, and contextualizes each move against the asset's own historical parabolic events.
🔹 OVERVIEW
Parabolic moves are notoriously difficult to recognize in real time. By the time they look obvious, the move is already late-stage. Conventional momentum tools (RSI, MACD, standard ROC) measure speed, not the underlying structural character of a parabolic move. They fire constantly on ordinary trends and miss what makes a parabolic move structurally different: the rate at which price is covering ATR-sized distance per bar.
Parabolic Move Detector closes that gap with a single, transparent metric. It measures how many ATRs price has moved per bar over a configurable lookback window. That is the literal mathematical definition of a parabolic move: sustained directional travel at an unusual speed relative to recent volatility. The framework auto-calibrates per timeframe and per asset, so a 15m memecoin pump and a 1D large-cap rally are measured with the same structural definition.
🔹 UNIQUE EDGE
Most acceleration or momentum indicators in the public space fall into two buckets: oscillators with hardcoded thresholds that need retuning per symbol, or composite "trend strength" meters that blur acceleration into raw trend direction. This tool is different in four concrete ways:
1. Single-metric detection engine. The entire detection pipeline is driven by one transparent number: Parabolic Pace = cumulative price move divided by cumulative ATR over the lookback. No percentiles, no hidden regressions, no black-box composite. This makes the tool easy to audit, fast to calibrate, and consistent across assets.
2. ATR-normalized by design. Because pace is expressed in ATRs per bar, it is inherently timeframe-adaptive and asset-adaptive. No need to retune for BTC vs a thin-volume altcoin, or for 15m vs 1W.
3. Four-phase state machine. Each move is classified through a deterministic lifecycle — Accelerating → Peaking → Decelerating → Exhaustion — with explicit transition conditions rather than heuristic labels. This turns a vague concept ("it looks parabolic") into a reproducible state with measurable transitions.
4. Per-asset historical statistics. The tool logs every completed parabolic cycle on the current chart, filters out micro-events, and reports the average duration and average drawdown from peak. That gives structural context no oscillator provides: what has this specific asset actually done the last N times it went parabolic.
🔹 METHODOLOGY
Core detection pipeline:
• Pace is computed as (close − close[N]) divided by (ATR14 × N), where N is the lookback window. The result is the number of ATRs traveled per bar.
• Pace is lightly smoothed with a short SMA to reduce single-bar noise.
• Detection triggers when smoothed pace exceeds the Pace Threshold and the move is directionally up.
• A minimum-duration filter requires the pace condition to persist for N consecutive bars before confirming the start, eliminating single-bar spikes.
• A post-move cooldown prevents the same move being re-detected as multiple events.
State machine transitions:
• Idle → Accelerating : pace sustained above threshold for the minimum duration.
• Accelerating → Peaking : Acceleration Score drops >20% from its cycle peak while still elevated.
• Any phase → Decelerating : score drops below 40% of cycle peak.
• Decelerating → Exhaustion : pace rolls over below half-threshold, and the move has lived at least 6 bars.
• Exhaustion → Idle : cooldown bars elapsed and score collapsed.
Acceleration Score (0-100) is a direct function of pace: score rises linearly with pace and receives a small persistence bonus for sustained upward momentum, capped at 100.
Historical statistics:
Each time a full cycle closes on the chart, the tool checks whether the move traveled at least the minimum ATRs from start to peak. If it qualifies, duration (start bar to peak bar) and drawdown from move high to subsequent low are averaged into rolling per-asset statistics.
🔹 STATES AND VISUALS
• Parabolic Zone : gradient background across the active move. Color reflects phase (brand blue in Accelerating, indigo in Peaking, amber in Decelerating). Intensity scales with Acceleration Score.
• Parabolic Start label : marks the confirmed start bar of a new move.
• Peaking / Decelerating labels : mark phase transitions. Labels are automatically suppressed within a confluence window to prevent stacking.
• Exhaustion label : marks the bar where the move has structurally collapsed.
• Duration Projection : dotted forward line sized to the asset's historical average parabolic duration, shown only while a move is active.
🔹 KEY INPUTS
Detection group:
• Pace Lookback — window over which parabolic pace is measured.
• Pace Threshold — minimum ATRs-per-bar required to qualify as parabolic.
• Minimum Move Duration — bars of sustained pace required before confirming a start.
• Minimum Event Size — minimum ATR-normalized move size required to log an event in historical statistics.
• Post-Move Cooldown — minimum bars after a completed move before a new one can start.
Historical Stats group:
• Show Duration Projection — toggle the forward projection line.
• Projection Length — forward projection cap in bars.
Visuals group:
• Parabolic Zone Background, Ambient Score Tint, Parabolic Start Label, Exhaustion Warning Label, Phase Transition Labels — all independently toggleable.
Style group:
• Label Size, Panel Size, Help Text Size — default Normal.
• Panel Location — six anchor positions.
• Panel Theme — Dark or Light.
Alerts group:
• Parabolic Start, Peaking Phase Reached, Exhaustion Detected — individually toggleable alerts.
🔹 HOW TO USE
• On any asset and any timeframe, wait for a confirmed Accelerating phase. The Parabolic Start label marks the reference bar.
• Track the Acceleration Score as the move develops. A score climbing toward 60-100 indicates a textbook parabolic.
• Compare Move Age against the panel's Avg Duration statistic. Moves significantly older than the asset's historical average are in late-cycle territory.
• Compare Move Change % against the Avg Reversal statistic for post-move drawdown context.
• Watch for the Peaking transition — this is the first structural deceleration, not a reversal call.
• The Exhaustion state marks where pace has decisively collapsed and the move is structurally over.
• Combine with your existing trend, structure, or volume framework. This tool is designed to complement directional analysis, not replace it.
🔹 LIMITATIONS AND TRANSPARENCY
• The tool detects and classifies acceleration structure. It does not predict reversals, tops, or bottoms. Avg Reversal is a post-cycle statistic computed from completed events on the current chart, not a forward-looking forecast.
• Historical statistics require completed cycles on the chart. Newly loaded symbols with few prior parabolic events will show low sample sizes until more cycles complete.
• The tool confirms a move only after pace has been sustained for the minimum duration. The start label is therefore plotted retroactively on its true start bar, which is the correct academic behavior for a sustained-condition detector.
• All computations are on confirmed bar close logic. No repainting of historical signals once a bar closes.
• The Pace metric requires a valid ATR reading, so at least 14+ bars of history are needed before the tool becomes active on a fresh chart.
🔹 RISK DISCLOSURE
This script is an analytical tool provided for educational and research purposes only. It is not a trading strategy, not financial advice, and does not generate buy or sell recommendations. Trading any market involves substantial risk of loss. All decisions and their consequences are the sole responsibility of the user. Past behavior of parabolic cycles on any asset does not guarantee future behavior.
A dedicated framework for identifying, measuring, and classifying parabolic price acceleration across any asset and any timeframe. Built on a single transparent metric — Parabolic Pace — the tool objectively detects the start bar of a parabolic move, tracks its age, scores its intensity on a 0-100 scale, classifies its lifecycle phase, and contextualizes each move against the asset's own historical parabolic events.
🔹 OVERVIEW
Parabolic moves are notoriously difficult to recognize in real time. By the time they look obvious, the move is already late-stage. Conventional momentum tools (RSI, MACD, standard ROC) measure speed, not the underlying structural character of a parabolic move. They fire constantly on ordinary trends and miss what makes a parabolic move structurally different: the rate at which price is covering ATR-sized distance per bar.
Parabolic Move Detector closes that gap with a single, transparent metric. It measures how many ATRs price has moved per bar over a configurable lookback window. That is the literal mathematical definition of a parabolic move: sustained directional travel at an unusual speed relative to recent volatility. The framework auto-calibrates per timeframe and per asset, so a 15m memecoin pump and a 1D large-cap rally are measured with the same structural definition.
🔹 UNIQUE EDGE
Most acceleration or momentum indicators in the public space fall into two buckets: oscillators with hardcoded thresholds that need retuning per symbol, or composite "trend strength" meters that blur acceleration into raw trend direction. This tool is different in four concrete ways:
1. Single-metric detection engine. The entire detection pipeline is driven by one transparent number: Parabolic Pace = cumulative price move divided by cumulative ATR over the lookback. No percentiles, no hidden regressions, no black-box composite. This makes the tool easy to audit, fast to calibrate, and consistent across assets.
2. ATR-normalized by design. Because pace is expressed in ATRs per bar, it is inherently timeframe-adaptive and asset-adaptive. No need to retune for BTC vs a thin-volume altcoin, or for 15m vs 1W.
3. Four-phase state machine. Each move is classified through a deterministic lifecycle — Accelerating → Peaking → Decelerating → Exhaustion — with explicit transition conditions rather than heuristic labels. This turns a vague concept ("it looks parabolic") into a reproducible state with measurable transitions.
4. Per-asset historical statistics. The tool logs every completed parabolic cycle on the current chart, filters out micro-events, and reports the average duration and average drawdown from peak. That gives structural context no oscillator provides: what has this specific asset actually done the last N times it went parabolic.
🔹 METHODOLOGY
Core detection pipeline:
• Pace is computed as (close − close[N]) divided by (ATR14 × N), where N is the lookback window. The result is the number of ATRs traveled per bar.
• Pace is lightly smoothed with a short SMA to reduce single-bar noise.
• Detection triggers when smoothed pace exceeds the Pace Threshold and the move is directionally up.
• A minimum-duration filter requires the pace condition to persist for N consecutive bars before confirming the start, eliminating single-bar spikes.
• A post-move cooldown prevents the same move being re-detected as multiple events.
State machine transitions:
• Idle → Accelerating : pace sustained above threshold for the minimum duration.
• Accelerating → Peaking : Acceleration Score drops >20% from its cycle peak while still elevated.
• Any phase → Decelerating : score drops below 40% of cycle peak.
• Decelerating → Exhaustion : pace rolls over below half-threshold, and the move has lived at least 6 bars.
• Exhaustion → Idle : cooldown bars elapsed and score collapsed.
Acceleration Score (0-100) is a direct function of pace: score rises linearly with pace and receives a small persistence bonus for sustained upward momentum, capped at 100.
Historical statistics:
Each time a full cycle closes on the chart, the tool checks whether the move traveled at least the minimum ATRs from start to peak. If it qualifies, duration (start bar to peak bar) and drawdown from move high to subsequent low are averaged into rolling per-asset statistics.
🔹 STATES AND VISUALS
• Parabolic Zone : gradient background across the active move. Color reflects phase (brand blue in Accelerating, indigo in Peaking, amber in Decelerating). Intensity scales with Acceleration Score.
• Parabolic Start label : marks the confirmed start bar of a new move.
• Peaking / Decelerating labels : mark phase transitions. Labels are automatically suppressed within a confluence window to prevent stacking.
• Exhaustion label : marks the bar where the move has structurally collapsed.
• Duration Projection : dotted forward line sized to the asset's historical average parabolic duration, shown only while a move is active.
🔹 KEY INPUTS
Detection group:
• Pace Lookback — window over which parabolic pace is measured.
• Pace Threshold — minimum ATRs-per-bar required to qualify as parabolic.
• Minimum Move Duration — bars of sustained pace required before confirming a start.
• Minimum Event Size — minimum ATR-normalized move size required to log an event in historical statistics.
• Post-Move Cooldown — minimum bars after a completed move before a new one can start.
Historical Stats group:
• Show Duration Projection — toggle the forward projection line.
• Projection Length — forward projection cap in bars.
Visuals group:
• Parabolic Zone Background, Ambient Score Tint, Parabolic Start Label, Exhaustion Warning Label, Phase Transition Labels — all independently toggleable.
Style group:
• Label Size, Panel Size, Help Text Size — default Normal.
• Panel Location — six anchor positions.
• Panel Theme — Dark or Light.
Alerts group:
• Parabolic Start, Peaking Phase Reached, Exhaustion Detected — individually toggleable alerts.
🔹 HOW TO USE
• On any asset and any timeframe, wait for a confirmed Accelerating phase. The Parabolic Start label marks the reference bar.
• Track the Acceleration Score as the move develops. A score climbing toward 60-100 indicates a textbook parabolic.
• Compare Move Age against the panel's Avg Duration statistic. Moves significantly older than the asset's historical average are in late-cycle territory.
• Compare Move Change % against the Avg Reversal statistic for post-move drawdown context.
• Watch for the Peaking transition — this is the first structural deceleration, not a reversal call.
• The Exhaustion state marks where pace has decisively collapsed and the move is structurally over.
• Combine with your existing trend, structure, or volume framework. This tool is designed to complement directional analysis, not replace it.
🔹 LIMITATIONS AND TRANSPARENCY
• The tool detects and classifies acceleration structure. It does not predict reversals, tops, or bottoms. Avg Reversal is a post-cycle statistic computed from completed events on the current chart, not a forward-looking forecast.
• Historical statistics require completed cycles on the chart. Newly loaded symbols with few prior parabolic events will show low sample sizes until more cycles complete.
• The tool confirms a move only after pace has been sustained for the minimum duration. The start label is therefore plotted retroactively on its true start bar, which is the correct academic behavior for a sustained-condition detector.
• All computations are on confirmed bar close logic. No repainting of historical signals once a bar closes.
• The Pace metric requires a valid ATR reading, so at least 14+ bars of history are needed before the tool becomes active on a fresh chart.
🔹 RISK DISCLOSURE
This script is an analytical tool provided for educational and research purposes only. It is not a trading strategy, not financial advice, and does not generate buy or sell recommendations. Trading any market involves substantial risk of loss. All decisions and their consequences are the sole responsibility of the user. Past behavior of parabolic cycles on any asset does not guarantee future behavior.
Notes de version
🔧 UPDATE NOTES - 1.6This update focuses on panel consistency, label control, theme support, and publication-ready readability.
The core purpose of the script remains unchanged.
This release improves how the existing parabolic pace, acceleration score, lifecycle phase, exhaustion context, and historical statistics are presented on the chart.
This script continues to function as an analytical and visualization tool.
It does not attempt to predict price direction or provide guaranteed outcomes.
------------------------
What Changed
------------------------
• Standardized the AG Pro panel header
The panel now uses a single merged blue header row with the script panel title.
• Added Show Panel control
Users can now show or hide the dashboard panel from settings. It remains enabled by default.
• Expanded panel themes and positions
Added Elite Dark, Slate, and Clean Light themes, plus broader panel placement options.
• Added label-density controls
Added Label Cooldown Bars and Max Visible Labels to prevent crowded label clusters during fast parabolic moves.
• Refined chart labels
Labels now use clearer two-line wording where helpful, including PARABOLIC START, PEAKING PHASE, and EXHAUSTION RISK.
• Preserved the core analytical model
The Parabolic Pace, Acceleration Score, phase machine, historical duration, historical reversal, and duration projection remain rule-based and consistent with the prior release.
------------------------
Visual Improvements
------------------------
• Improved label spacing during strong acceleration phases
• Reduced redundant phase labels during fast multi-bar expansion
• Refined panel row contrast across dark, slate, and light themes
• Kept the AGPro blue header visually consistent with the current series standard
------------------------
Interface & Usability
------------------------
• Added panel show / hide control
• Added stronger panel theme flexibility
• Added broader panel location support
• Kept label and panel font-size controls with Huge support
------------------------
Behavior Notes
------------------------
This update does not change the core analytical logic of the script.
The goal is to improve chart clarity and visual control, not to introduce predictive behavior.
Users should interpret outputs the same way as before, with cleaner labels and a more consistent panel layout.
------------------------
Limitations Reminder
------------------------
The script remains a rule-based analytical tool.
Volatility, liquidity, symbol behavior, and timeframe differences may affect how parabolic phases appear.
Outputs should always be interpreted within broader market context.
------------------------
Risk Reminder
------------------------
This script is for educational and analytical purposes only.
It does not provide financial advice or guaranteed trading outcomes.
Users remain responsible for their own decisions.
Notes de version
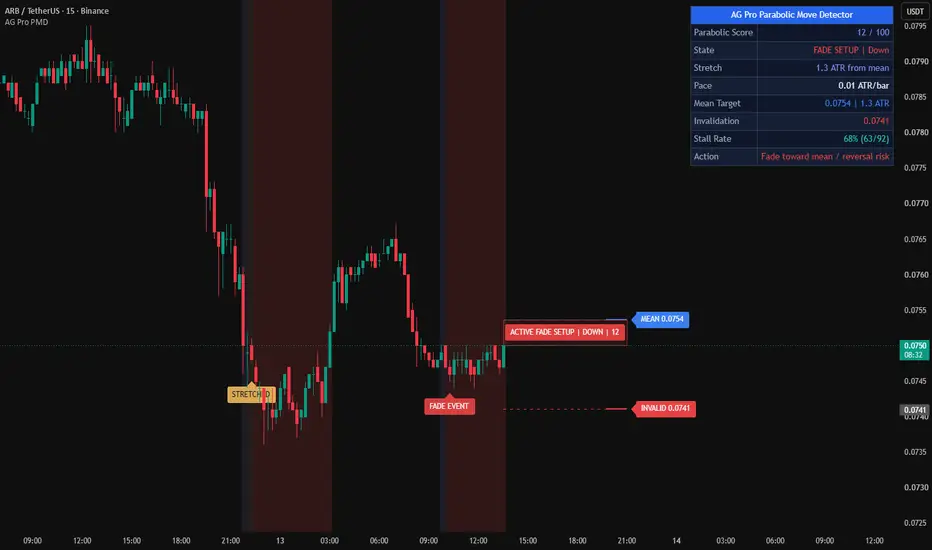
🔧 UPDATE NOTES - v1.7This update rebuilds the script as a parabolic-move decision engine.
The core idea is unchanged: detect fast, parabolic price acceleration. What changes is how that read is presented. Instead of only labeling lifecycle phases, the script now judges whether a move is still worth riding or is stretched and likely to fade, and shows the decision context on a clean chart. It remains an analytical and visualization tool. It does not predict price direction or provide guaranteed outcomes.
------------------------
What Changed
------------------------
• Added a 0-100 Parabolic Score.
The score blends transparent ATR-per-bar pace, ATR-normalized stretch from a baseline, and acceleration persistence into a single read of how parabolic and how stretched the move is.
• Reframed the states as decisions.
The lifecycle now reads BUILDING, PARABOLIC, STRETCHED, and FADE SETUP, each paired with a clear next action (watch, ride with a trailing stop, treat chase risk as high, or fade toward the mean).
• Added a decision layer.
The panel and chart now show a mean-reversion target (the baseline) with the fade room in ATR, plus an invalidation reference set behind the parabolic extreme.
• Added a Stall Rate.
On each FADE SETUP, the engine snapshots the parabolic extreme. It resolves as a miss if price extends beyond the invalidation rail (the parabola kept pushing), otherwise as a hit when the move held inside the rail through the proof window (the parabolic push stalled). This honestly validates the exhaustion read rather than promising a profitable counter-trend trade, since fading a strong trend is inherently low-probability.
• Rebuilt the visuals around one clean stretch corridor.
The cluttered phase-label stack is gone. A single corridor between price and the mean-reversion target carries a centered, contrast-safe state badge, with target and invalidation rails projected to the right.
• Reworked label handling.
Only the actionable STRETCHED and FADE SETUP transitions print labels, and clustered labels are stacked from the previous label's actual position so they never overlap, even during fast spikes.
• Standardized contrast and the volatility reference.
All on-chart text computes a readable color from its background, and the ATR baseline falls back to true range and a minimum tick on early bars.
------------------------
Visual Improvements
------------------------
• Replaced the overlapping phase-label cluster with a single clean corridor and badge.
• Added clearly separated mean-reversion and invalidation rails.
• Kept the chart quiet when no parabolic context is active.
• Improved contrast and spacing of every on-chart element.
------------------------
Interface & Usability
------------------------
• Redesigned the panel into a decision flow: score, state, stretch, pace, mean target, invalidation, stall rate, and action.
• Improved readability across all themes and font sizes.
• Enhanced overall first-glance clarity.
------------------------
Behavior Notes
------------------------
The script still detects parabolic acceleration; it now adds a decision and reliability layer around that read.
The goal is to help interpret a fast move, not to introduce predictive behavior.
------------------------
Limitations Reminder
------------------------
The script remains a rule-based analytical tool.
Market conditions such as volatility, liquidity, and timeframe differences may affect how states, the corridor, and the stall rate appear.
Outputs should always be interpreted within broader market context.
------------------------
Risk Reminder
------------------------
This script is for educational and analytical purposes only.
It does not provide financial advice or guaranteed trading outcomes.
Users remain responsible for their own decisions.
Notes de version
🔧 UPDATE NOTES - V1.8This update focuses on active-plan ownership, price clarity, and collision-resistant rail spacing.
• Reframed the centered corridor badge as the single active plan, with direction and score in one compact premium badge.
• Added live prices to the mean-target and invalidation badges.
• Added owned connector segments so displaced badges remain visibly tied to their exact price rails.
• Added ATR- and font-aware dynamic separation when the two rail badges approach each other.
• Recast historical fade markers as secondary FADE EVENT badges to distinguish them from the active setup.
The parabolic engine, score model, state lifecycle, stall-rate proof logic, and alerts remain unchanged.
Script open-source
Dans l'esprit TradingView, le créateur de ce script l'a rendu open source afin que les traders puissent examiner et vérifier ses fonctionnalités. Bravo à l'auteur! Bien que vous puissiez l'utiliser gratuitement, n'oubliez pas que la republication du code est soumise à nos Règles.

Trading Suite | Flagship Workflow :
tradingview.com/script/XJmX3p98-Trading-Suite-AGPro-Series/
Crypto Setup Planner | Multi-Symbol Analysis :
tradingview.com/script/LgVRo7Ql-Crypto-Setup-Planner-AGPro-Series/
tradingview.com/script/XJmX3p98-Trading-Suite-AGPro-Series/
Crypto Setup Planner | Multi-Symbol Analysis :
tradingview.com/script/LgVRo7Ql-Crypto-Setup-Planner-AGPro-Series/
Clause de non-responsabilité
Les informations et publications ne sont pas destinées à être, et ne constituent pas, des conseils ou recommandations financiers, d'investissement, de trading ou autres fournis ou approuvés par TradingView. Pour en savoir plus, consultez les Conditions d'utilisation.
Script open-source
Dans l'esprit TradingView, le créateur de ce script l'a rendu open source afin que les traders puissent examiner et vérifier ses fonctionnalités. Bravo à l'auteur! Bien que vous puissiez l'utiliser gratuitement, n'oubliez pas que la republication du code est soumise à nos Règles.
Trading Suite | Flagship Workflow :
tradingview.com/script/XJmX3p98-Trading-Suite-AGPro-Series/
Crypto Setup Planner | Multi-Symbol Analysis :
tradingview.com/script/LgVRo7Ql-Crypto-Setup-Planner-AGPro-Series/
tradingview.com/script/XJmX3p98-Trading-Suite-AGPro-Series/
Crypto Setup Planner | Multi-Symbol Analysis :
tradingview.com/script/LgVRo7Ql-Crypto-Setup-Planner-AGPro-Series/
Clause de non-responsabilité
Les informations et publications ne sont pas destinées à être, et ne constituent pas, des conseils ou recommandations financiers, d'investissement, de trading ou autres fournis ou approuvés par TradingView. Pour en savoir plus, consultez les Conditions d'utilisation.