OPEN-SOURCE SCRIPT
Mis à jour DVOL/(UVOL+DVOL) 5min INTRADAY
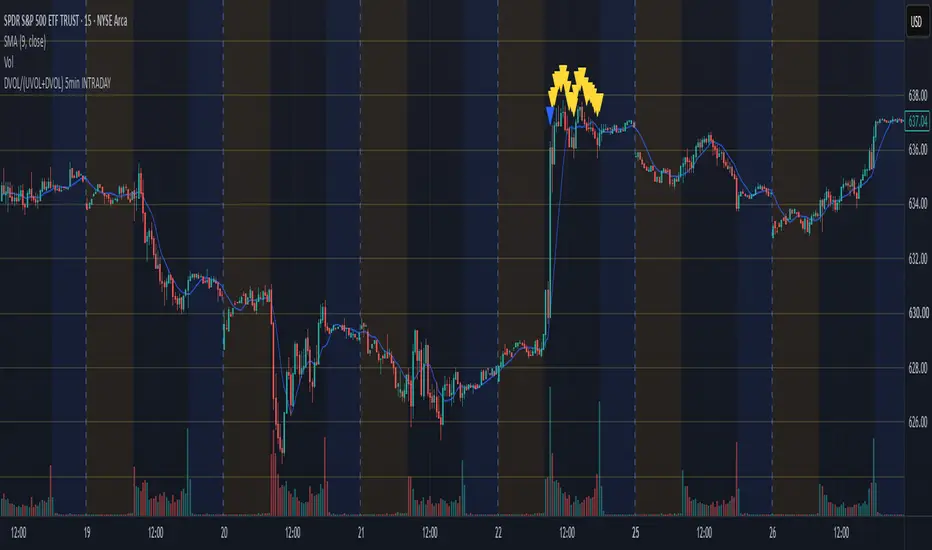
Overview:
This indicator tracks broad US market volume breadth in real-time to identify extreme intraday volume imbalances. By comparing Down Volume (USI:DVOL) against total volume (UVOL + DVOL) on a 5-minute timeframe, it pinpoints moments of aggressive market-wide buying and selling pressure that often signal intraday exhaustion points, reversals, or momentum continuation.
How It Works
The script calculates the ratio of declining volume against total market volume on every 5-minute candle:
Down Volume Ratio = DVOL / (UVOL+DVOL)
Extreme Down-Volume / Selling Pressure >= 89.9%
Triggers when down volume accounts for 89.9% or more of all traded volume across US markets. This often marks extreme panic selling or capitulation.
Extreme Up-Volume / Buying Pressure <= 9.9%
Triggers when down volume is under 10 (meaning Up Volume is 90%+).This marks broad-based market buying frenzies.
🟠 Orange Triangle (Below Bar) — Single High Threshold:
First occurrence of extreme market selling volume (≥89.9)
🟣 Purple Triangle (Below Bar) — Repeated High Threshold:
Extreme selling volume triggered when the condition has already appeared 2 or more times over the past 3 days (clustered selling pressure).
🔵 Blue Triangle (Above Bar) — Single Low Threshold:
First occurrence of extreme market buying volume (≤9.9%)
🟡 Yellow Triangle (Above Bar) — Repeated Low Threshold:
Extreme buying volume triggered when the condition has appeared 2 or more times over the past 3 days (clustered buying pressure).
Built-in Webhook & JSON Alerts
Whenever any single or repeated volume threshold is met, the indicator triggers a ready-to-use JSON alert payload (firing once per bar):
JSON:
{"text": "Trading Signal: Intraday SCALPING ONLY Short-Term trade SPY Triggered at [Price] Ticker [Ticker] Chart [Timeframe]"}
This is ideal for automated execution, Discord/Telegram webhooks, or alert routing.
This is designed specifically for SPY , SP500 indices , ES_F1! on a intraday timeframe and for intraday trading only.
This indicator tracks broad US market volume breadth in real-time to identify extreme intraday volume imbalances. By comparing Down Volume (USI:DVOL) against total volume (UVOL + DVOL) on a 5-minute timeframe, it pinpoints moments of aggressive market-wide buying and selling pressure that often signal intraday exhaustion points, reversals, or momentum continuation.
How It Works
The script calculates the ratio of declining volume against total market volume on every 5-minute candle:
Down Volume Ratio = DVOL / (UVOL+DVOL)
Extreme Down-Volume / Selling Pressure >= 89.9%
Triggers when down volume accounts for 89.9% or more of all traded volume across US markets. This often marks extreme panic selling or capitulation.
Extreme Up-Volume / Buying Pressure <= 9.9%
Triggers when down volume is under 10 (meaning Up Volume is 90%+).This marks broad-based market buying frenzies.
🟠 Orange Triangle (Below Bar) — Single High Threshold:
First occurrence of extreme market selling volume (≥89.9)
🟣 Purple Triangle (Below Bar) — Repeated High Threshold:
Extreme selling volume triggered when the condition has already appeared 2 or more times over the past 3 days (clustered selling pressure).
🔵 Blue Triangle (Above Bar) — Single Low Threshold:
First occurrence of extreme market buying volume (≤9.9%)
🟡 Yellow Triangle (Above Bar) — Repeated Low Threshold:
Extreme buying volume triggered when the condition has appeared 2 or more times over the past 3 days (clustered buying pressure).
Built-in Webhook & JSON Alerts
Whenever any single or repeated volume threshold is met, the indicator triggers a ready-to-use JSON alert payload (firing once per bar):
JSON:
{"text": "Trading Signal: Intraday SCALPING ONLY Short-Term trade SPY Triggered at [Price] Ticker [Ticker] Chart [Timeframe]"}
This is ideal for automated execution, Discord/Telegram webhooks, or alert routing.
This is designed specifically for
SPY , SP500 indices , ES_F1! on a intraday timeframe and for intraday trading only. Notes de version
Overview:This indicator tracks broad US market volume breadth in real-time to identify extreme intraday volume imbalances. By comparing Down Volume (USI:DVOL) against total volume (UVOL + DVOL) on a 5-minute timeframe, it pinpoints moments of aggressive market-wide buying and selling pressure that often signal intraday exhaustion points, reversals, or momentum continuation.
How It Works
The script calculates the ratio of declining volume against total market volume on every 5-minute candle:
Down Volume Ratio = DVOL / (UVOL+DVOL)
Extreme Down-Volume / Selling Pressure >= 89.9%
Triggers when down volume accounts for 89.9% or more of all traded volume across US markets. This often marks extreme panic selling or capitulation.
Extreme Up-Volume / Buying Pressure <= 9.9%
Triggers when down volume is under 10 (meaning Up Volume is 90%+).This marks broad-based market buying frenzies.
🟠 Orange Triangle (Below Bar) — Single High Threshold:
First occurrence of extreme market selling volume (≥89.9)
🟣 Purple Triangle (Below Bar) — Repeated High Threshold:
Extreme selling volume triggered when the condition has already appeared 2 or more times over the past 3 days (clustered selling pressure).
🔵 Blue Triangle (Above Bar) — Single Low Threshold:
First occurrence of extreme market buying volume (≤9.9%)
🟡 Yellow Triangle (Above Bar) — Repeated Low Threshold:
Extreme buying volume triggered when the condition has appeared 2 or more times over the past 3 days (clustered buying pressure).
Built-in Webhook & JSON Alerts
Whenever any single or repeated volume threshold is met, the indicator triggers a ready-to-use JSON alert payload (firing once per bar):
JSON:
{"text": "Trading Signal: Intraday SCALPING ONLY Short-Term trade SPY Triggered at [Price] Ticker [Ticker] Chart [Timeframe]"}
This is ideal for automated execution, Discord/Telegram webhooks, or alert routing.
This is designed specifically for
SPY
, SP500 indices , ES_F1! on a intraday timeframe and for intraday trading only.
Notes de version
V3 Fixed a bug where the signal triggers prematurely at the day's opening print
Script open-source
Dans l'esprit TradingView, le créateur de ce script l'a rendu open source afin que les traders puissent examiner et vérifier ses fonctionnalités. Bravo à l'auteur! Bien que vous puissiez l'utiliser gratuitement, n'oubliez pas que la republication du code est soumise à nos Règles.

Clause de non-responsabilité
Les informations et publications ne sont pas destinées à être, et ne constituent pas, des conseils ou recommandations financiers, d'investissement, de trading ou autres fournis ou approuvés par TradingView. Pour en savoir plus, consultez les Conditions d'utilisation.
Script open-source
Dans l'esprit TradingView, le créateur de ce script l'a rendu open source afin que les traders puissent examiner et vérifier ses fonctionnalités. Bravo à l'auteur! Bien que vous puissiez l'utiliser gratuitement, n'oubliez pas que la republication du code est soumise à nos Règles.
Clause de non-responsabilité
Les informations et publications ne sont pas destinées à être, et ne constituent pas, des conseils ou recommandations financiers, d'investissement, de trading ou autres fournis ou approuvés par TradingView. Pour en savoir plus, consultez les Conditions d'utilisation.