Mis à jour
YTP Zones - Higher-Timeframe S/R Zones with a Decoy Test
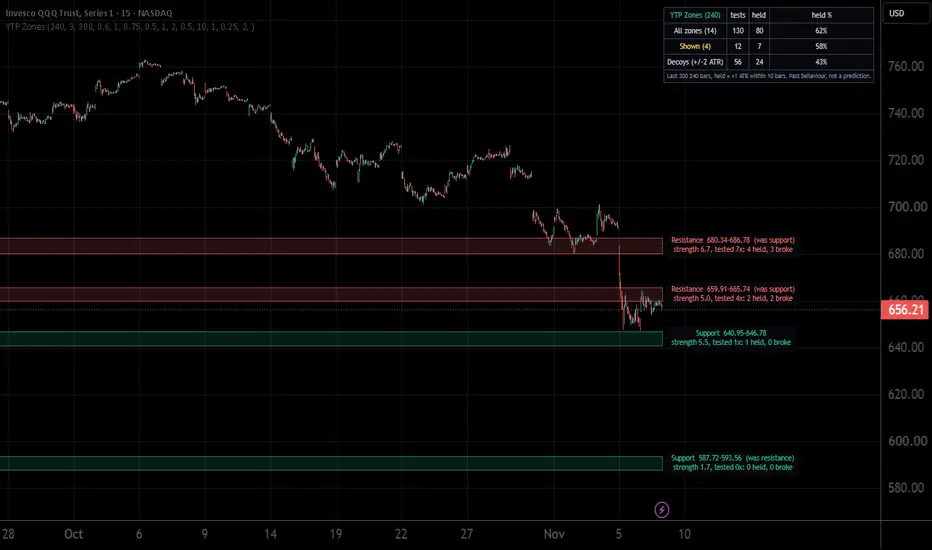
YTP Zones draws a few higher-timeframe support and resistance zones on any chart and shows how price has behaved at each one, next to a decoy baseline, so you can judge whether the zones mean anything on that symbol before you rely on them.
WHAT IT DOES
- Builds zones from confirmed swing highs and lows on a zone timeframe (default 4 hours) and draws them on the chart you are viewing. A 15-minute chart shows a handful of 4h zones instead of many thin intraday slices.
- Shows up to two zones above and two below price (nearest first), plus the zone price is currently inside.
- Keeps zones that price has closed through and tags them "was support" or "was resistance".
- Labels each zone with its strength and its record: how many times price tested it, how many times it held and how many times it broke.
- A table scores all zones, the zones on screen, and DECOYS (the same bands moved to prices with no swing history) with the identical test.
HOW IT WORKS
1. Pivots: swing highs and lows on the zone timeframe (3 bars each side by default) within the lookback (300 zone-timeframe bars).
2. Clustering: pivots within 0.6 ATR are grouped; each group becomes a band at least 0.5 ATR tall. Neighbouring bands closer than 0.75 ATR merge, capped at 1 ATR tall.
3. Strength: how far price moved away from the pivots that formed the zone, measured in ATR.
4. One zone per area: zones within 0.5 ATR of the nearest zone on the same side count as one area, and only the strongest one is drawn.
5. Record: a test is a zone-timeframe bar that reaches the band from outside (prior close beyond it). Held = price moves 1 ATR beyond the band's far side within 10 bars. Broke = a close 0.25 ATR through the band comes first. All of these are inputs.
6. Decoys: each band is shifted 2 ATR away (stepped further until it overlaps no real zone) and scored the same way. If real zones do not beat the decoys on a symbol, treat the zones there as noise.
Higher-timeframe values come from the previous completed bar (offset [1]), so zones do not repaint.
HOW TO USE IT
- Works on intraday and daily charts. If the zone timeframe is lower than the chart timeframe, the chart timeframe is used.
- Load enough history: on a 15-minute chart with 4h zones, pick a 6-month range so the lookback fills.
- Read the table first. Compare held % for the shown zones with held % for the decoys on the same symbol and window.
- "Compare other zones" input: type any bands as lo-hi, comma separated (for example from your own analysis) and they are scored by the same test.
WHAT IS DIFFERENT
Most zone tools draw levels with no way to check them. This one scores every zone on its own history and puts that score next to a decoy baseline from the same symbol and window. Zones are built on a higher timeframe and reduced to one per area to keep the chart readable.
LIMITATIONS
- The record is in-sample: zones are drawn from the same history they are scored on, and a few tests mean little.
- Held and broke depend on the ATR settings; change them and the numbers change.
- Past behaviour, not a prediction. Not a trade signal and not financial advice.
WHAT IT DOES
- Builds zones from confirmed swing highs and lows on a zone timeframe (default 4 hours) and draws them on the chart you are viewing. A 15-minute chart shows a handful of 4h zones instead of many thin intraday slices.
- Shows up to two zones above and two below price (nearest first), plus the zone price is currently inside.
- Keeps zones that price has closed through and tags them "was support" or "was resistance".
- Labels each zone with its strength and its record: how many times price tested it, how many times it held and how many times it broke.
- A table scores all zones, the zones on screen, and DECOYS (the same bands moved to prices with no swing history) with the identical test.
HOW IT WORKS
1. Pivots: swing highs and lows on the zone timeframe (3 bars each side by default) within the lookback (300 zone-timeframe bars).
2. Clustering: pivots within 0.6 ATR are grouped; each group becomes a band at least 0.5 ATR tall. Neighbouring bands closer than 0.75 ATR merge, capped at 1 ATR tall.
3. Strength: how far price moved away from the pivots that formed the zone, measured in ATR.
4. One zone per area: zones within 0.5 ATR of the nearest zone on the same side count as one area, and only the strongest one is drawn.
5. Record: a test is a zone-timeframe bar that reaches the band from outside (prior close beyond it). Held = price moves 1 ATR beyond the band's far side within 10 bars. Broke = a close 0.25 ATR through the band comes first. All of these are inputs.
6. Decoys: each band is shifted 2 ATR away (stepped further until it overlaps no real zone) and scored the same way. If real zones do not beat the decoys on a symbol, treat the zones there as noise.
Higher-timeframe values come from the previous completed bar (offset [1]), so zones do not repaint.
HOW TO USE IT
- Works on intraday and daily charts. If the zone timeframe is lower than the chart timeframe, the chart timeframe is used.
- Load enough history: on a 15-minute chart with 4h zones, pick a 6-month range so the lookback fills.
- Read the table first. Compare held % for the shown zones with held % for the decoys on the same symbol and window.
- "Compare other zones" input: type any bands as lo-hi, comma separated (for example from your own analysis) and they are scored by the same test.
WHAT IS DIFFERENT
Most zone tools draw levels with no way to check them. This one scores every zone on its own history and puts that score next to a decoy baseline from the same symbol and window. Zones are built on a higher timeframe and reduced to one per area to keep the chart readable.
LIMITATIONS
- The record is in-sample: zones are drawn from the same history they are scored on, and a few tests mean little.
- Held and broke depend on the ATR settings; change them and the numbers change.
- Past behaviour, not a prediction. Not a trade signal and not financial advice.
Notes de version
Fix: two zones on the same side could be drawn overlapping each other when the area rule picked a stronger zone further out (for example NVDA daily showed 193.63-197.97 and 197.50-201.18 together). Drawn zones on one side now never overlap: overlapping neighbours compete and only the stronger one is shown. Zones that do not overlap are unchanged.Notes de version
New: thin-volume gaps. The script estimates a volume-by-price profile from the zone-timeframe bars (each bar's volume spread evenly over its high-low range, quarter-ATR price bins). Stretches between the drawn zones where volume per price is under half the median of traded prices are shaded grey and labelled "thin volume": little trading happened there. Inputs: on/off and the threshold (default 0.5x median).Honesty check in the table: for every close in the later half of the window, the close is classed thin or busy using only the volume of the bars before it, and the table shows how far price moved over the next 5 bars (in ATR) from thin vs busy closes. On 8 large US names on daily charts (Nov 2026) thin closes moved 1.50 ATR vs 1.40 from busy, with 3 of the 8 going the other way, so treat it as a description of where trading was light, not a signal. Symbols with no volume data show nothing. Volume on some feeds (e.g. BATS) is a partial count; the shape is what matters.
Notes de version
v25: alerts. In TradingView's Create Alert dialog, pick YTP Zones as the condition, then one of three price events, checked against the zones drawn on your chart: Pulled back to a zone from above; Close crossed below a zone; Close crossed above a zone. Use 'Once per bar close' so each bar has finished before the alert fires (on a daily chart, that means after the daily close). The zones and the drawing are unchanged. These alerts describe what price did against a zone. They are not buy or sell signals, and nothing here says a zone will hold. Educational only, not financial advice.
Clause de non-responsabilité
Les informations et publications ne sont pas destinées à être, et ne constituent pas, des conseils ou recommandations financiers, d'investissement, de trading ou autres fournis ou approuvés par TradingView. Pour en savoir plus, consultez les Conditions d'utilisation.
Clause de non-responsabilité
Les informations et publications ne sont pas destinées à être, et ne constituent pas, des conseils ou recommandations financiers, d'investissement, de trading ou autres fournis ou approuvés par TradingView. Pour en savoir plus, consultez les Conditions d'utilisation.