AMANTUS TSI
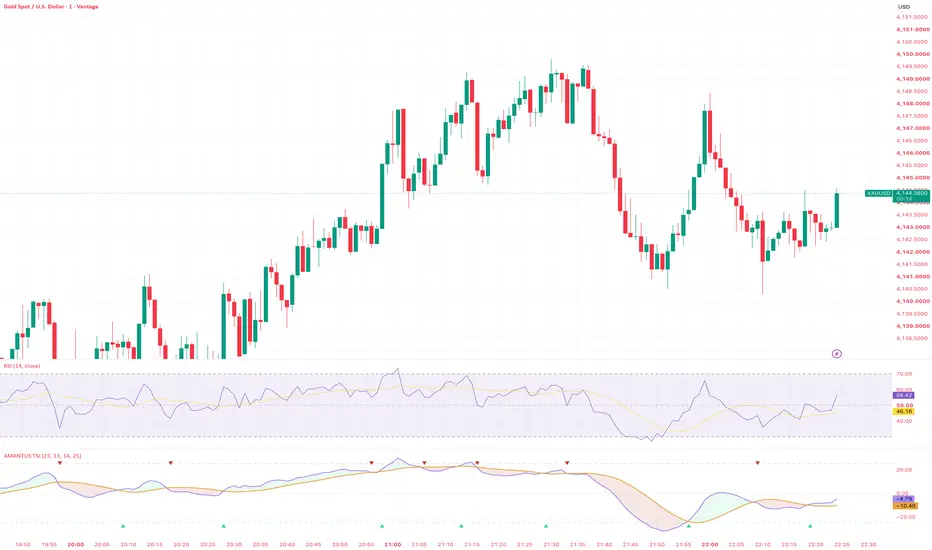
AMANTUS TSI — True Strength Index with Signal Line, Zones & Cross Markers
What it is
A clean, no-nonsense implementation of William Blau's True Strength Index — a double-smoothed momentum oscillator that filters out price noise while staying responsive to real shifts in strength. Paired with an SMA signal line, overbought/oversold zones and clear crossover markers, it gives you a complete momentum read-out in one pane.
How it works
Double smoothing is what makes TSI different from RSI or a plain momentum line: it reacts to sustained pressure, not single-bar spikes. In practice this often makes TSI more informative than RSI — especially in precious metals, where sharp intraday swings keep RSI pinned in extreme zones while TSI still shows whether the underlying momentum is building or fading.
What you see
How to read it
Settings
Alerts
Two built-in alert conditions: TSI BULL cross and TSI BEAR cross.
Notes
© amant.us 2026. Open source — use it, study it, build on it. Modification and redistribution are welcome with attribution to amant.us. Feedback welcome.
What it is
A clean, no-nonsense implementation of William Blau's True Strength Index — a double-smoothed momentum oscillator that filters out price noise while staying responsive to real shifts in strength. Paired with an SMA signal line, overbought/oversold zones and clear crossover markers, it gives you a complete momentum read-out in one pane.
How it works
- Price change (close − previous close) is smoothed twice with EMAs (25, then 13).
- The absolute price change is smoothed the same way.
- TSI = 100 × (smoothed change / smoothed absolute change), bounded between −100 and +100.
- A 14-period SMA of the TSI serves as the signal line.
Double smoothing is what makes TSI different from RSI or a plain momentum line: it reacts to sustained pressure, not single-bar spikes. In practice this often makes TSI more informative than RSI — especially in precious metals, where sharp intraday swings keep RSI pinned in extreme zones while TSI still shows whether the underlying momentum is building or fading.
What you see
- TSI line (violet) and Signal line (amber).
- Gap fill: green when TSI is above the signal, red when below — momentum direction at a glance.
- Zone lines at ±25 (adjustable) and a dotted zero line.
- ▲ / ▼ markers on bullish and bearish crossovers.
How to read it
- TSI crosses above the signal → momentum turning bullish; above zero → bulls in control.
- TSI crosses below the signal → momentum turning bearish; below zero → bears in control.
- Readings beyond ±25 flag stretched conditions — crosses from these zones back toward zero are the classic mean-reversion setups.
- Divergence between TSI peaks/troughs and price often precedes a turn.
Settings
- Long smoothing (25), Short smoothing (13), Signal SMA (14)
- Zone boundary (±25)
- Toggle crossover markers and gap fill
Alerts
Two built-in alert conditions: TSI BULL cross and TSI BEAR cross.
Notes
- Works on any symbol and timeframe. Developed and tested on XAUUSD.
- Signals are confirmed at bar close and do not repaint afterwards.
- Early values depend on the amount of loaded history (EMA warm-up).
© amant.us 2026. Open source — use it, study it, build on it. Modification and redistribution are welcome with attribution to amant.us. Feedback welcome.

Clause de non-responsabilité
Les informations et publications ne sont pas destinées à être, et ne constituent pas, des conseils ou recommandations financiers, d'investissement, de trading ou autres fournis ou approuvés par TradingView. Pour en savoir plus, consultez les Conditions d'utilisation.
Clause de non-responsabilité
Les informations et publications ne sont pas destinées à être, et ne constituent pas, des conseils ou recommandations financiers, d'investissement, de trading ou autres fournis ou approuvés par TradingView. Pour en savoir plus, consultez les Conditions d'utilisation.