OPEN-SOURCE SCRIPT
Nadaraya-Watson Regression Liquidity Sweeps [AlgoAlpha]
🟠 OVERVIEW
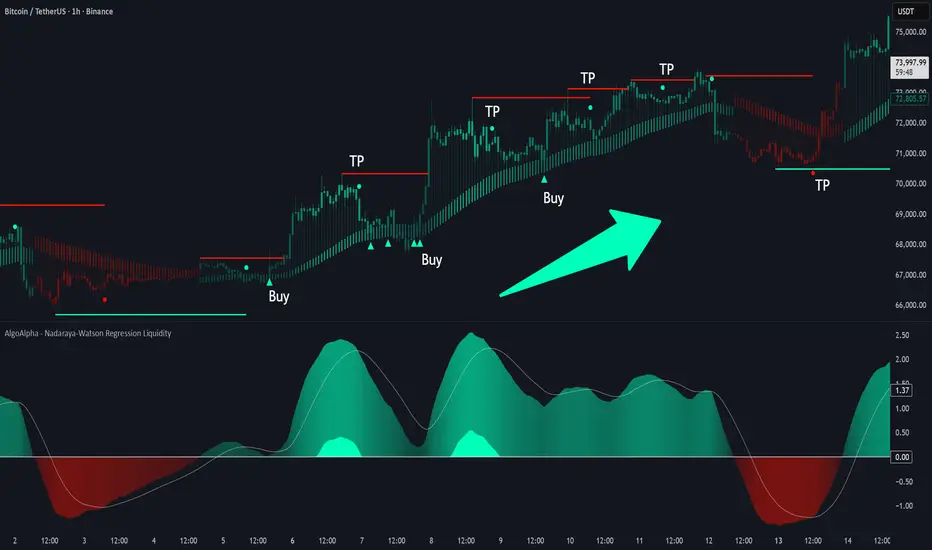
This script combines Nadaraya-Watson regression, momentum analysis, and liquidity level tracking into a single workflow. It measures the slope of a smoothed price regression curve, converts that slope into a normalized oscillator, and uses momentum shifts to identify areas where liquidity may be resting.
The oscillator is built from the rate of change of the Nadaraya-Watson estimate rather than price itself. This allows momentum transitions to be measured relative to the underlying regression trend. When momentum weakens after an extended move, the script records swing-based liquidity levels that can later be swept by price.
A volatility-adjusted Nadaraya-Watson band is also displayed on the chart. This provides context for trend direction, momentum strength, and potential rebound conditions around the regression value.
🟠 CONCEPTS
🟠 FEATURES
🟠 HOW TO USE
🟠 CONCLUSION
The Nadaraya-Watson Regression Liquidity Sweeps indicator combines regression-based momentum analysis, volatility-adjusted trend structure, and liquidity level tracking. By linking momentum transitions to swing-derived liquidity zones, it helps identify where liquidity may be forming and when it has been swept. This provides traders with additional context for trend analysis, pullbacks, and potential reversal areas.
This script combines Nadaraya-Watson regression, momentum analysis, and liquidity level tracking into a single workflow. It measures the slope of a smoothed price regression curve, converts that slope into a normalized oscillator, and uses momentum shifts to identify areas where liquidity may be resting.
The oscillator is built from the rate of change of the Nadaraya-Watson estimate rather than price itself. This allows momentum transitions to be measured relative to the underlying regression trend. When momentum weakens after an extended move, the script records swing-based liquidity levels that can later be swept by price.
A volatility-adjusted Nadaraya-Watson band is also displayed on the chart. This provides context for trend direction, momentum strength, and potential rebound conditions around the regression value.
🟠 CONCEPTS
- Nadaraya-Watson Regression — A kernel-based smoothing method that estimates an underlying price curve by weighting nearby historical data more heavily than distant data.
- Normalized Regression Slope — The change in the Nadaraya-Watson estimate divided by its recent standard deviation, allowing momentum strength to be compared across different market conditions.
- Liquidity Sweep Level — A horizontal level created from a swing high or swing low when momentum begins to weaken, representing an area that may later attract price.
- Oscillator Signal Line — An EMA of the normalized oscillator used to identify momentum crossovers and momentum phase changes.
- Rebound Condition — A signal generated when price moves back through the Nadaraya-Watson value while oscillator direction remains aligned with the prevailing momentum bias.
🟠 FEATURES
- Normalized Nadaraya-Watson Oscillator — Measures momentum using the slope of a smoothed regression curve.
- Liquidity Sweep Detection — Creates liquidity levels when bullish or bearish momentum begins to weaken.
- Volatility-Adjusted Regression Band — Displays a dynamic overlay around the Nadaraya-Watson estimate using smoothed ATR values.
- Momentum Weakening Signals — Marks locations where oscillator momentum begins to lose strength against the current directional bias.
- Rebound Signals — Highlights situations where price reclaims or loses the regression value while momentum remains aligned with trend direction.
🟠 HOW TO USE
- Monitor the oscillator relative to its signal line to identify momentum shifts and changes in directional bias.
- Watch for newly created liquidity levels after momentum weakening events, as these levels may become future sweep targets.
- Use sweeps of upper or lower liquidity levels to identify areas where price has taken resting liquidity.
- Look for bullish rebound signals when price reclaims the regression value while bullish momentum remains active.
- Look for bearish rebound signals when price loses the regression value while bearish momentum remains active.
- Combine oscillator direction, liquidity levels, and regression band structure to build context around trend continuation or reversal scenarios.
🟠 CONCLUSION
The Nadaraya-Watson Regression Liquidity Sweeps indicator combines regression-based momentum analysis, volatility-adjusted trend structure, and liquidity level tracking. By linking momentum transitions to swing-derived liquidity zones, it helps identify where liquidity may be forming and when it has been swept. This provides traders with additional context for trend analysis, pullbacks, and potential reversal areas.
Script open-source
Dans l'esprit TradingView, le créateur de ce script l'a rendu open source afin que les traders puissent examiner et vérifier ses fonctionnalités. Bravo à l'auteur! Bien que vous puissiez l'utiliser gratuitement, n'oubliez pas que la republication du code est soumise à nos Règles.

🚨Get premium: algoalpha.io
🛜Get FREE signals: discord.gg/xCmqTVRexz
💡Tutorials: youtube.com/@AlgoAlpha
🛜Get FREE signals: discord.gg/xCmqTVRexz
💡Tutorials: youtube.com/@AlgoAlpha
Clause de non-responsabilité
Les informations et publications ne sont pas destinées à être, et ne constituent pas, des conseils ou recommandations financiers, d'investissement, de trading ou autres fournis ou approuvés par TradingView. Pour en savoir plus, consultez les Conditions d'utilisation.
Script open-source
Dans l'esprit TradingView, le créateur de ce script l'a rendu open source afin que les traders puissent examiner et vérifier ses fonctionnalités. Bravo à l'auteur! Bien que vous puissiez l'utiliser gratuitement, n'oubliez pas que la republication du code est soumise à nos Règles.
🚨Get premium: algoalpha.io
🛜Get FREE signals: discord.gg/xCmqTVRexz
💡Tutorials: youtube.com/@AlgoAlpha
🛜Get FREE signals: discord.gg/xCmqTVRexz
💡Tutorials: youtube.com/@AlgoAlpha
Clause de non-responsabilité
Les informations et publications ne sont pas destinées à être, et ne constituent pas, des conseils ou recommandations financiers, d'investissement, de trading ou autres fournis ou approuvés par TradingView. Pour en savoir plus, consultez les Conditions d'utilisation.