Mis à jour
[SignalFI] Tick Speed
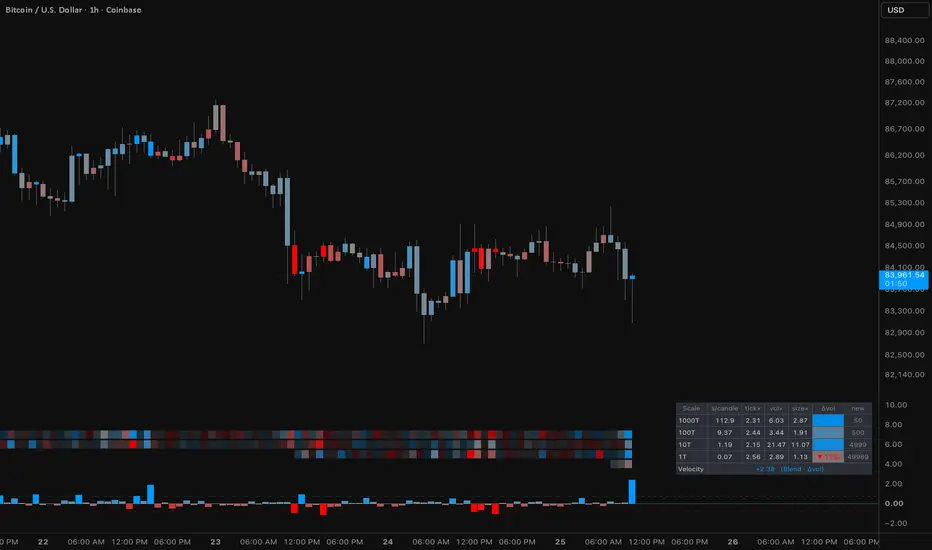
Tick Speed measures how fast TradingView's tick candles (1T, 10T, 100T and 1000T) are forming, how much volume they carry and which way that flow is pushing, and shows it on a regular time-based chart. You can watch the pace of the tape while trading from a 1-minute or 5-minute chart, without keeping four tick charts open.
It was built for liquid futures such as NQ and MNQ on 1m to 5m charts, and works on any symbol that has tick intervals on TradingView.
WHY TICK SPEED
A tick candle closes after a fixed number of trades, not a fixed amount of time. Its duration therefore tells you how busy the market is: when 100 trades print in 8 seconds instead of the usual 25, participation has surged. Time-based candles hide this, because every bar lasts the same time whether 50 trades printed or 5,000.
Tick Speed puts each tick scale next to its own recent normal, so you can see when activity accelerates, which scales it is happening on, and whether buyers or sellers are driving it.
HOW IT WORKS
Each scale is read from its own tick timeframe with request.security_lower_tf(). The 10T, 100T and 1000T readings come from the real tick candles TradingView builds; they are not 1T counts divided by 10, 100 or 1000.
For every chart bar and every scale, the script measures:
- s/candle: average seconds per tick candle over the last few closed candles (the "Candles" input). If the candle that is still forming has already taken longer than that average, its elapsed time is used instead, so a stall shows up immediately rather than after the candle closes. For 1T it is seconds per trade inside the chart bar.
- tick×: trades per second divided by its own moving baseline. 1.00 is normal pace and 2.00 is twice normal.
- vol×: contracts (volume) per second divided by its own baseline.
- size×: average contracts per trade divided by its own baseline. Above 1 means larger trades than usual; below 1 means small-lot churn.
- dir (price direction): the price efficiency of the recent tick candles, net move divided by total move, from -100% to +100%. For 1T it is the balance of upticks and downticks.
- Δvol (volume delta): from -100% to +100%.
- On 1T, each trade is classified as buyer- or seller-initiated from the bid and ask: at or above the ask is a buy, at or below the bid is a sell, and trades in between are compared with the midpoint. When bid/ask is missing or the trade is exactly at the midpoint, the uptick/downtick rule is used instead.
- On 10T, 100T and 1000T, it is the volume of up-moving candles minus the volume of down-moving candles, divided by total volume. This is close to true aggressor delta on 10T and coarser on 1000T.
Every "×" value has its own independent baseline (an EMA over the "Speed Baseline" number of chart bars), so each scale is always compared with its own normal.
SPEED AND DIRECTION BASIS
Two inputs choose what drives the ribbons, composite, bar colouring and alerts:
- Speed Basis:
- Ticks = trade pace (tick×).
- Volume = contract pace (vol×).
- Blend (default) = the geometric mean of tick× and vol×. It reads 1.0 when both are normal and only runs high when trades and contracts are both running hot.
- Direction Basis:
- Price = price direction (dir).
- Volume delta (default) = Δvol.
WHAT YOU SEE
- Four ribbons, one per scale (1T at the bottom, 1000T at the top).
- Colour shows direction: green for up, red for down, grey for neutral.
- Opacity shows speed: faint at half of normal pace, solid at 2.5 times normal or more.
- A "wave" of solid colour moving from 1T up through 1000T means a fast burst is turning into sustained flow.
- Tick Velocity histogram: a weighted average of direction × speed across the enabled scales, clamped to ±3 for display, with ±threshold lines. The default weights favour the slower scales (1T 0.1, 10T 0.2, 100T 0.3, 1000T 0.4), and speed is capped inside the composite so one spike cannot dominate it.
- Optional price bar colouring by Tick Velocity.
- Dashboard with one row per scale: Scale | s/candle | tick× | vol× | size× | Δvol or dir | new. "new" is the number of new tick candles (or trades, for 1T) in the current chart bar. The last row shows the Tick Velocity value and the active bases.
- Data Window: tick×, vol×, size×, dir and Δvol for every scale, plus s/candle and the unclamped velocity.
HOW TO READ IT
- Speed values above 1.5 on several scales at once, with the same direction, mean the market is moving with real participation behind it.
- Fast pace with neutral direction usually means two-sided churn or absorption rather than a trend.
- size× rising while tick× stays flat means fewer, larger trades are hitting the market.
- Slowing speed (values falling below 1) after a move shows participation drying up.
- Tick Speed is a context tool. It shows the pace and pressure of the tape; it does not generate trade entries on its own and should be combined with your own analysis and risk management.
ALERTS
- Tick Velocity Up / Down: the composite crosses above the upper threshold or below the lower threshold.
- Aligned Surge Up / Down: at least two scales have data, all of them point the same way, and each one's speed is above the "Surge ×norm" input.
INPUTS
- Tick Scales: turn each scale on or off, set its weight in the composite, and set how many closed candles it averages over.
- Volume: Speed Basis and Direction Basis.
- Calculation: Speed Baseline length (chart bars) and the speed cap used inside the composite.
- Signals: velocity threshold and surge level.
- Visuals: up, down and neutral colours, and price bar colouring.
- Dashboard: show or hide, position and text size.
REQUIREMENTS AND LIMITATIONS
- Your TradingView plan and the symbol must support tick-based intervals. Scales with no tick data show "no tick data" in the dashboard and are left out of the composite.
- Use it on a time-based chart. On a tick chart, the script shows a notice instead of values.
- Tick history is limited. 1T data runs out first (a few hundred 1-minute bars on MNQ), followed by 10T and 100T; 1000T usually covers the whole chart. Older bars therefore show fewer ribbons.
- Realtime tick data can arrive a few seconds late. The stall timer follows the newest tick received rather than the wall clock, so fast scales are not falsely marked as stalled.
- Values on the forming bar update until the bar closes.
- The script always requests standard candle data, so it gives the same readings on Heikin Ashi and other chart types as on regular candles.
- Volume delta on 10T, 100T and 1000T is based on candle direction, not an individual trade-by-trade split. Only 1T uses the bid/ask classification.
- Bid/ask classification depends on the data feed supplying bid and ask for each trade. Where it is not supplied, the uptick/downtick rule is used.
This script is for informational and educational purposes only and is not financial advice.
It was built for liquid futures such as NQ and MNQ on 1m to 5m charts, and works on any symbol that has tick intervals on TradingView.
WHY TICK SPEED
A tick candle closes after a fixed number of trades, not a fixed amount of time. Its duration therefore tells you how busy the market is: when 100 trades print in 8 seconds instead of the usual 25, participation has surged. Time-based candles hide this, because every bar lasts the same time whether 50 trades printed or 5,000.
Tick Speed puts each tick scale next to its own recent normal, so you can see when activity accelerates, which scales it is happening on, and whether buyers or sellers are driving it.
HOW IT WORKS
Each scale is read from its own tick timeframe with request.security_lower_tf(). The 10T, 100T and 1000T readings come from the real tick candles TradingView builds; they are not 1T counts divided by 10, 100 or 1000.
For every chart bar and every scale, the script measures:
- s/candle: average seconds per tick candle over the last few closed candles (the "Candles" input). If the candle that is still forming has already taken longer than that average, its elapsed time is used instead, so a stall shows up immediately rather than after the candle closes. For 1T it is seconds per trade inside the chart bar.
- tick×: trades per second divided by its own moving baseline. 1.00 is normal pace and 2.00 is twice normal.
- vol×: contracts (volume) per second divided by its own baseline.
- size×: average contracts per trade divided by its own baseline. Above 1 means larger trades than usual; below 1 means small-lot churn.
- dir (price direction): the price efficiency of the recent tick candles, net move divided by total move, from -100% to +100%. For 1T it is the balance of upticks and downticks.
- Δvol (volume delta): from -100% to +100%.
- On 1T, each trade is classified as buyer- or seller-initiated from the bid and ask: at or above the ask is a buy, at or below the bid is a sell, and trades in between are compared with the midpoint. When bid/ask is missing or the trade is exactly at the midpoint, the uptick/downtick rule is used instead.
- On 10T, 100T and 1000T, it is the volume of up-moving candles minus the volume of down-moving candles, divided by total volume. This is close to true aggressor delta on 10T and coarser on 1000T.
Every "×" value has its own independent baseline (an EMA over the "Speed Baseline" number of chart bars), so each scale is always compared with its own normal.
SPEED AND DIRECTION BASIS
Two inputs choose what drives the ribbons, composite, bar colouring and alerts:
- Speed Basis:
- Ticks = trade pace (tick×).
- Volume = contract pace (vol×).
- Blend (default) = the geometric mean of tick× and vol×. It reads 1.0 when both are normal and only runs high when trades and contracts are both running hot.
- Direction Basis:
- Price = price direction (dir).
- Volume delta (default) = Δvol.
WHAT YOU SEE
- Four ribbons, one per scale (1T at the bottom, 1000T at the top).
- Colour shows direction: green for up, red for down, grey for neutral.
- Opacity shows speed: faint at half of normal pace, solid at 2.5 times normal or more.
- A "wave" of solid colour moving from 1T up through 1000T means a fast burst is turning into sustained flow.
- Tick Velocity histogram: a weighted average of direction × speed across the enabled scales, clamped to ±3 for display, with ±threshold lines. The default weights favour the slower scales (1T 0.1, 10T 0.2, 100T 0.3, 1000T 0.4), and speed is capped inside the composite so one spike cannot dominate it.
- Optional price bar colouring by Tick Velocity.
- Dashboard with one row per scale: Scale | s/candle | tick× | vol× | size× | Δvol or dir | new. "new" is the number of new tick candles (or trades, for 1T) in the current chart bar. The last row shows the Tick Velocity value and the active bases.
- Data Window: tick×, vol×, size×, dir and Δvol for every scale, plus s/candle and the unclamped velocity.
HOW TO READ IT
- Speed values above 1.5 on several scales at once, with the same direction, mean the market is moving with real participation behind it.
- Fast pace with neutral direction usually means two-sided churn or absorption rather than a trend.
- size× rising while tick× stays flat means fewer, larger trades are hitting the market.
- Slowing speed (values falling below 1) after a move shows participation drying up.
- Tick Speed is a context tool. It shows the pace and pressure of the tape; it does not generate trade entries on its own and should be combined with your own analysis and risk management.
ALERTS
- Tick Velocity Up / Down: the composite crosses above the upper threshold or below the lower threshold.
- Aligned Surge Up / Down: at least two scales have data, all of them point the same way, and each one's speed is above the "Surge ×norm" input.
INPUTS
- Tick Scales: turn each scale on or off, set its weight in the composite, and set how many closed candles it averages over.
- Volume: Speed Basis and Direction Basis.
- Calculation: Speed Baseline length (chart bars) and the speed cap used inside the composite.
- Signals: velocity threshold and surge level.
- Visuals: up, down and neutral colours, and price bar colouring.
- Dashboard: show or hide, position and text size.
REQUIREMENTS AND LIMITATIONS
- Your TradingView plan and the symbol must support tick-based intervals. Scales with no tick data show "no tick data" in the dashboard and are left out of the composite.
- Use it on a time-based chart. On a tick chart, the script shows a notice instead of values.
- Tick history is limited. 1T data runs out first (a few hundred 1-minute bars on MNQ), followed by 10T and 100T; 1000T usually covers the whole chart. Older bars therefore show fewer ribbons.
- Realtime tick data can arrive a few seconds late. The stall timer follows the newest tick received rather than the wall clock, so fast scales are not falsely marked as stalled.
- Values on the forming bar update until the bar closes.
- The script always requests standard candle data, so it gives the same readings on Heikin Ashi and other chart types as on regular candles.
- Volume delta on 10T, 100T and 1000T is based on candle direction, not an individual trade-by-trade split. Only 1T uses the bid/ask classification.
- Bid/ask classification depends on the data feed supplying bid and ask for each trade. Where it is not supplied, the uptick/downtick rule is used.
This script is for informational and educational purposes only and is not financial advice.
Notes de version
Format
SignalFi is creating cutting edge TradingView scripts to help identify rogue market Alpha. Check out signalfi.net for subscription information and @signalfi_ on Twitter for updates.
Clause de non-responsabilité
Les informations et publications ne sont pas destinées à être, et ne constituent pas, des conseils ou recommandations financiers, d'investissement, de trading ou autres fournis ou approuvés par TradingView. Pour en savoir plus, consultez les Conditions d'utilisation.
SignalFi is creating cutting edge TradingView scripts to help identify rogue market Alpha. Check out signalfi.net for subscription information and @signalfi_ on Twitter for updates.
Clause de non-responsabilité
Les informations et publications ne sont pas destinées à être, et ne constituent pas, des conseils ou recommandations financiers, d'investissement, de trading ou autres fournis ou approuvés par TradingView. Pour en savoir plus, consultez les Conditions d'utilisation.