OPEN-SOURCE SCRIPT
Mis à jour R2D2 Market Intelligence Bar
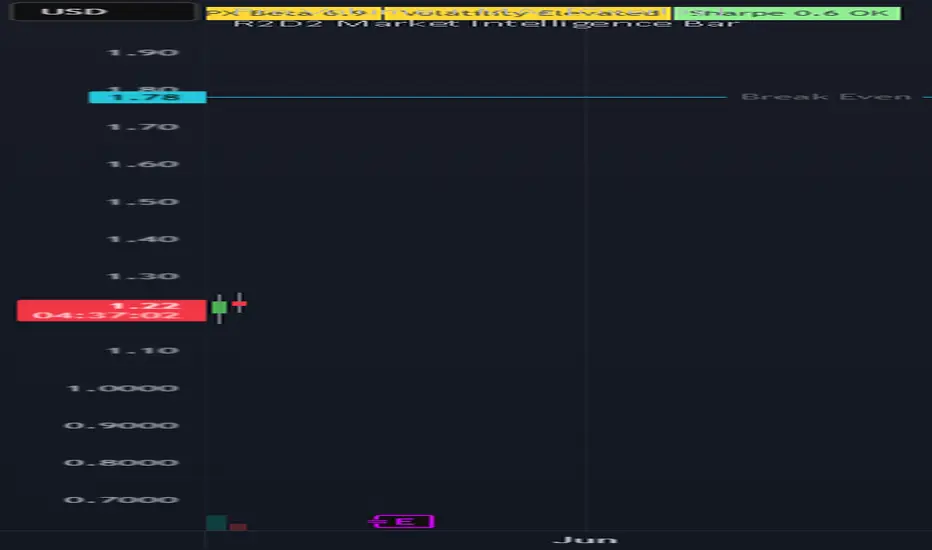
R2D2 Market Intelligence Bar: The Ultimate All-In-One Dashboard
Overview
The R2D2 Market Intelligence Bar is a comprehensive, customizable dashboard designed to give traders and investors an immediate, high-level read of an asset’s technical and fundamental health. Positioned neatly at the top right of your chart, this indicator eliminates the need to constantly switch tabs or clutter your screen with a dozen different sub-charts.
Whether you are scanning a watchlist for momentum setups or doing due diligence on a long-term investment, the R2D2 bar consolidates the most critical quantitative metrics into a single, color-coded heads-up display.
Key Features & Metrics
The dashboard bridges the gap between technical price action and fundamental valuation. It includes:
1. The Performance Matrix (1W, 1M, 2M, 3M, 6M, 1Y, 2Y)
Instantly view the asset's rolling percentage returns across seven distinct timeframes. The background color of these cells acts as a visual heat map:
Light Green: Exceptional gains (+100% or more)
Lime Green: Standard positive returns
Bright Red: Standard negative returns
Dark Red: Severe drawdowns (-10% or worse)
2. Risk & Volatility Management
ATR %: The Average True Range expressed as a percentage of the current price, showing how much the asset swings daily.
Volatility Status: Automatically categorizes current volatility as Low, Normal, or Elevated based on the ATR percentage.
TS (Trail Stop): A dynamically calculated trailing stop-loss level, derived directly from your custom ATR multiplier settings.
Volume (V %): Shows current volume momentum by comparing today's volume against the 20-day Simple Moving Average (SMA).
3. Quantitative & Fundamental Health
SPX Beta: Measures the asset's 1-year volatility and correlation relative to a benchmark (default is the S&P 500 / SPY). A Beta over 1.0 means it is more volatile than the broader market.
Sharpe Ratio: Evaluates the 1-year annualized risk-adjusted return. The dashboard automatically grades the Sharpe ratio as Good, OK, or Poor.
PE Ratio: Trailing Twelve Months (TTM) Price-to-Earnings ratio.
Net Income Margin (NIM): Shows the fundamental profitability of the company.
Dividend Yield: The current TTM yield for income investors.
Complete Customization
Every trader's strategy is different. The R2D2 Intelligence Bar features a robust Dashboard Visibility menu that allows you to toggle every single metric on or off.
Only care about technicals? Turn off the PE, Yield, and NIM. Want a cleaner screen on a smaller monitor? Drop the text size down to "Tiny" or hide the longer timeframes. The dashboard dynamically resizes itself so there are no empty, dead spaces. You can also adjust the core technical settings, including the ATR Length, the Trail Stop Multiplier, and the benchmark ticker used for the Beta calculation.
Important Notes for Users
Asset Limitations: Fundamental metrics (PE Ratio, Net Income Margin, and Dividend Yield) utilize TradingView's request.financial() functions. These metrics will only populate when viewing Equities (Stocks). If you apply this indicator to Crypto, Forex, or Futures, those specific cells will gracefully display as "N/A" or "0%" while the technical and performance metrics continue to calculate perfectly.
Sharpe Ratio: The Sharpe ratio calculated in this script is a simplified 1-year annualized metric assuming a 0% risk-free rate, designed specifically for quick relative comparison between equities.
How to Use
Add the indicator to your chart.
Double-click the R2D2 bar (or open the indicator settings gear icon).
Under Technical Settings, define your risk tolerance by adjusting the ATR length and Trail Stop multiplier.
Under Dashboard Visibility, toggle the metrics to fit your exact trading style.
Trade smarter, not harder. Let R2D2 do the scanning.
Overview
The R2D2 Market Intelligence Bar is a comprehensive, customizable dashboard designed to give traders and investors an immediate, high-level read of an asset’s technical and fundamental health. Positioned neatly at the top right of your chart, this indicator eliminates the need to constantly switch tabs or clutter your screen with a dozen different sub-charts.
Whether you are scanning a watchlist for momentum setups or doing due diligence on a long-term investment, the R2D2 bar consolidates the most critical quantitative metrics into a single, color-coded heads-up display.
Key Features & Metrics
The dashboard bridges the gap between technical price action and fundamental valuation. It includes:
1. The Performance Matrix (1W, 1M, 2M, 3M, 6M, 1Y, 2Y)
Instantly view the asset's rolling percentage returns across seven distinct timeframes. The background color of these cells acts as a visual heat map:
Light Green: Exceptional gains (+100% or more)
Lime Green: Standard positive returns
Bright Red: Standard negative returns
Dark Red: Severe drawdowns (-10% or worse)
2. Risk & Volatility Management
ATR %: The Average True Range expressed as a percentage of the current price, showing how much the asset swings daily.
Volatility Status: Automatically categorizes current volatility as Low, Normal, or Elevated based on the ATR percentage.
TS (Trail Stop): A dynamically calculated trailing stop-loss level, derived directly from your custom ATR multiplier settings.
Volume (V %): Shows current volume momentum by comparing today's volume against the 20-day Simple Moving Average (SMA).
3. Quantitative & Fundamental Health
SPX Beta: Measures the asset's 1-year volatility and correlation relative to a benchmark (default is the S&P 500 / SPY). A Beta over 1.0 means it is more volatile than the broader market.
Sharpe Ratio: Evaluates the 1-year annualized risk-adjusted return. The dashboard automatically grades the Sharpe ratio as Good, OK, or Poor.
PE Ratio: Trailing Twelve Months (TTM) Price-to-Earnings ratio.
Net Income Margin (NIM): Shows the fundamental profitability of the company.
Dividend Yield: The current TTM yield for income investors.
Complete Customization
Every trader's strategy is different. The R2D2 Intelligence Bar features a robust Dashboard Visibility menu that allows you to toggle every single metric on or off.
Only care about technicals? Turn off the PE, Yield, and NIM. Want a cleaner screen on a smaller monitor? Drop the text size down to "Tiny" or hide the longer timeframes. The dashboard dynamically resizes itself so there are no empty, dead spaces. You can also adjust the core technical settings, including the ATR Length, the Trail Stop Multiplier, and the benchmark ticker used for the Beta calculation.
Important Notes for Users
Asset Limitations: Fundamental metrics (PE Ratio, Net Income Margin, and Dividend Yield) utilize TradingView's request.financial() functions. These metrics will only populate when viewing Equities (Stocks). If you apply this indicator to Crypto, Forex, or Futures, those specific cells will gracefully display as "N/A" or "0%" while the technical and performance metrics continue to calculate perfectly.
Sharpe Ratio: The Sharpe ratio calculated in this script is a simplified 1-year annualized metric assuming a 0% risk-free rate, designed specifically for quick relative comparison between equities.
How to Use
Add the indicator to your chart.
Double-click the R2D2 bar (or open the indicator settings gear icon).
Under Technical Settings, define your risk tolerance by adjusting the ATR length and Trail Stop multiplier.
Under Dashboard Visibility, toggle the metrics to fit your exact trading style.
Trade smarter, not harder. Let R2D2 do the scanning.
Notes de version
Updated to version 2.5. It wasn't retrieving the correct [same] values across different time intervals.Script open-source
Dans l'esprit TradingView, le créateur de ce script l'a rendu open source afin que les traders puissent examiner et vérifier ses fonctionnalités. Bravo à l'auteur! Bien que vous puissiez l'utiliser gratuitement, n'oubliez pas que la republication du code est soumise à nos Règles.

Clause de non-responsabilité
Les informations et publications ne sont pas destinées à être, et ne constituent pas, des conseils ou recommandations financiers, d'investissement, de trading ou autres fournis ou approuvés par TradingView. Pour en savoir plus, consultez les Conditions d'utilisation.
Script open-source
Dans l'esprit TradingView, le créateur de ce script l'a rendu open source afin que les traders puissent examiner et vérifier ses fonctionnalités. Bravo à l'auteur! Bien que vous puissiez l'utiliser gratuitement, n'oubliez pas que la republication du code est soumise à nos Règles.
Clause de non-responsabilité
Les informations et publications ne sont pas destinées à être, et ne constituent pas, des conseils ou recommandations financiers, d'investissement, de trading ou autres fournis ou approuvés par TradingView. Pour en savoir plus, consultez les Conditions d'utilisation.