OPEN-SOURCE SCRIPT
Mis à jour Stock Fundamental Performance:EPS and Revenue growth [Dots3Red]
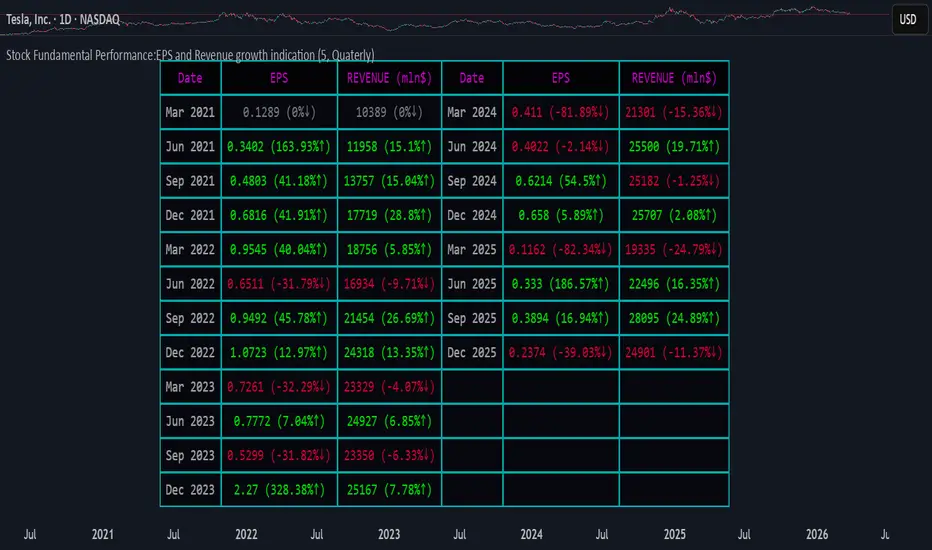
This indicator provides a clear and intuitive overview of a company’s revenue and EPS growth, helping you quickly evaluate its financial performance over time.
All data is displayed in a clean, easy-to-read table below the main chart, so you can analyze fundamentals without cluttering price action.
The indicator supports both annual and quarterly data, making it suitable for long-term investors and short-term traders alike.
In addition to raw values, it also shows the percentage change relative to the previous period, allowing you to instantly identify acceleration or deceleration in growth.
To improve visual clarity:
This color-coded system makes trend changes immediately visible at a glance.

How to use
By default, the table displays annual data for the last 5 years, offering a long-term perspective on company growth.
You can switch to quarterly data in the settings for a more granular analysis.
Limitations
Due to Pine Engine data request constraints, quarterly data is limited to a maximum lookback of 5 years.
Selecting a longer quarterly period may cause the data to appear out of chronological order. We are actively working on improvements to address this in future updates.
All data is displayed in a clean, easy-to-read table below the main chart, so you can analyze fundamentals without cluttering price action.
The indicator supports both annual and quarterly data, making it suitable for long-term investors and short-term traders alike.
In addition to raw values, it also shows the percentage change relative to the previous period, allowing you to instantly identify acceleration or deceleration in growth.
To improve visual clarity:
- Green values indicate an increase compared to the previous period
- Red values indicate a decrease compared to the previous period
This color-coded system makes trend changes immediately visible at a glance.
How to use
By default, the table displays annual data for the last 5 years, offering a long-term perspective on company growth.
You can switch to quarterly data in the settings for a more granular analysis.
Limitations
Due to Pine Engine data request constraints, quarterly data is limited to a maximum lookback of 5 years.
Selecting a longer quarterly period may cause the data to appear out of chronological order. We are actively working on improvements to address this in future updates.
Notes de version
Updated the colour schemeNotes de version
Updated the colour schemeScript open-source
Dans l'esprit TradingView, le créateur de ce script l'a rendu open source afin que les traders puissent examiner et vérifier ses fonctionnalités. Bravo à l'auteur! Bien que vous puissiez l'utiliser gratuitement, n'oubliez pas que la republication du code est soumise à nos Règles.

Connect the dots to elevate your trading.
Clause de non-responsabilité
Les informations et publications ne sont pas destinées à être, et ne constituent pas, des conseils ou recommandations financiers, d'investissement, de trading ou autres fournis ou approuvés par TradingView. Pour en savoir plus, consultez les Conditions d'utilisation.
Script open-source
Dans l'esprit TradingView, le créateur de ce script l'a rendu open source afin que les traders puissent examiner et vérifier ses fonctionnalités. Bravo à l'auteur! Bien que vous puissiez l'utiliser gratuitement, n'oubliez pas que la republication du code est soumise à nos Règles.
Connect the dots to elevate your trading.
Clause de non-responsabilité
Les informations et publications ne sont pas destinées à être, et ne constituent pas, des conseils ou recommandations financiers, d'investissement, de trading ou autres fournis ou approuvés par TradingView. Pour en savoir plus, consultez les Conditions d'utilisation.