OPEN-SOURCE SCRIPT
Mis à jour Multi-Timeframe Liquidity Zones
# Multi-Timeframe Liquidity Zones
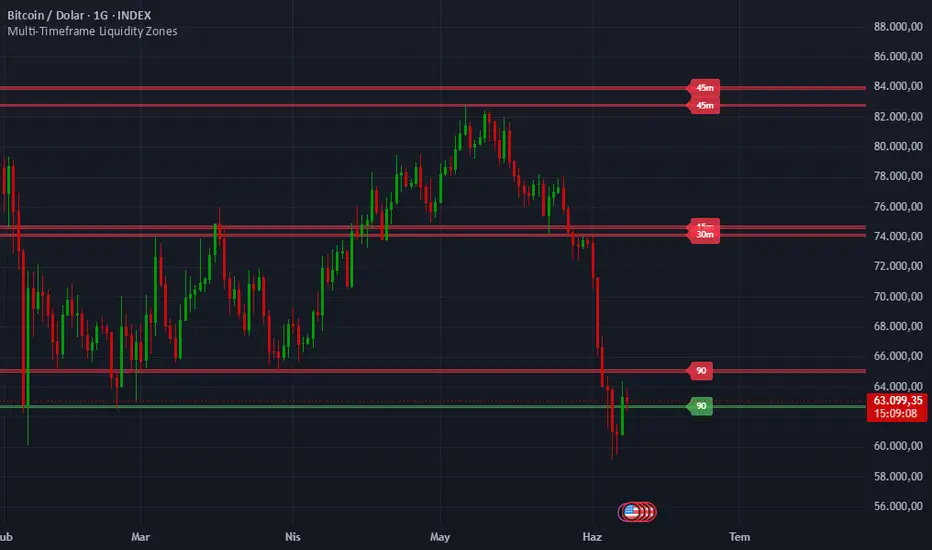
Multi-Timeframe Liquidity Zones automatically identifies and displays significant support and resistance areas derived from pivot structures across multiple timeframes.
Instead of relying on a single timeframe, the indicator combines pivot highs and pivot lows from up to four user-defined timeframes, helping traders identify key reaction zones where price may experience support, resistance, rejection, or liquidity sweeps.
The indicator intelligently filters nearby levels to reduce chart clutter and highlights only the most relevant zones. Each zone is labeled with its originating timeframe, making it easy to identify higher-timeframe confluence areas.
### Features
• Multi-timeframe support and resistance detection
• Up to four customizable timeframes
• Automatic level clustering and duplicate filtering
• Dynamic support and resistance zone visualization
• Timeframe labels for quick level identification
• Adjustable zone width
• Configurable number of displayed levels
• Clean and lightweight chart presentation
### How It Works
The indicator scans pivot highs and pivot lows from selected timeframes and converts them into price zones. Nearby levels are merged to eliminate redundancy and improve readability.
Resistance zones are displayed above the current market price, while support zones are displayed below it. This allows traders to quickly identify potential reversal areas, breakout levels, and liquidity pools.
### Best Used For
• Support and resistance trading
• Breakout confirmation
• Liquidity sweep analysis
• Market structure analysis
• Confluence-based trading strategies
• Multi-timeframe technical analysis
### Disclaimer
This indicator is intended for educational and analytical purposes only. No indicator can predict future market movements with certainty. Always use proper risk management and combine multiple forms of analysis before making trading decisions.
TradingView Short Description:
Identify high-probability support and resistance zones using pivot structures from multiple timeframes. The indicator filters overlapping levels, highlights key liquidity areas, and displays clean multi-timeframe confluence zones directly on the chart.
Multi-Timeframe Liquidity Zones automatically identifies and displays significant support and resistance areas derived from pivot structures across multiple timeframes.
Instead of relying on a single timeframe, the indicator combines pivot highs and pivot lows from up to four user-defined timeframes, helping traders identify key reaction zones where price may experience support, resistance, rejection, or liquidity sweeps.
The indicator intelligently filters nearby levels to reduce chart clutter and highlights only the most relevant zones. Each zone is labeled with its originating timeframe, making it easy to identify higher-timeframe confluence areas.
### Features
• Multi-timeframe support and resistance detection
• Up to four customizable timeframes
• Automatic level clustering and duplicate filtering
• Dynamic support and resistance zone visualization
• Timeframe labels for quick level identification
• Adjustable zone width
• Configurable number of displayed levels
• Clean and lightweight chart presentation
### How It Works
The indicator scans pivot highs and pivot lows from selected timeframes and converts them into price zones. Nearby levels are merged to eliminate redundancy and improve readability.
Resistance zones are displayed above the current market price, while support zones are displayed below it. This allows traders to quickly identify potential reversal areas, breakout levels, and liquidity pools.
### Best Used For
• Support and resistance trading
• Breakout confirmation
• Liquidity sweep analysis
• Market structure analysis
• Confluence-based trading strategies
• Multi-timeframe technical analysis
### Disclaimer
This indicator is intended for educational and analytical purposes only. No indicator can predict future market movements with certainty. Always use proper risk management and combine multiple forms of analysis before making trading decisions.
TradingView Short Description:
Identify high-probability support and resistance zones using pivot structures from multiple timeframes. The indicator filters overlapping levels, highlights key liquidity areas, and displays clean multi-timeframe confluence zones directly on the chart.
Notes de version
### How It Works — Technical DetailsThis indicator uses Pine Script's built-in ta.pivothigh() and ta.pivotlow()
functions to detect swing highs and swing lows. Both functions use a symmetric
lookback approach: a candle must have the highest high (or lowest low) compared
to an equal number of bars on both its left and right sides to qualify as a
valid pivot point. The Lookback Period input controls this left-right bar count
simultaneously.
Pivot levels from each active timeframe are collected and passed through a
proximity filter. If any two levels are within 1.5× the defined Zone Width of
each other, the second level is discarded. This prevents duplicate or
near-duplicate zones from cluttering the chart when multiple timeframes detect
similar price areas.
Each surviving level is rendered as a price zone — a fixed-width box centered
on the pivot price — colored red for resistance (above current close) or green
for support (below current close).
### How To Use
1. Set Timeframe 1 to your primary analysis timeframe (e.g. 1H)
2. Set higher timeframes progressively (e.g. 2H, 4H, 1D)
3. Lookback Period controls pivot sensitivity:
— Higher values (50–100): fewer, stronger pivots
— Lower values (5–20): more frequent, shorter-term pivots
4. Zone Width should match the asset's typical noise level:
— Crypto: 0.2–0.5% works well
— Forex: 0.05–0.1% recommended
— Equities: 0.1–0.3% recommended
5. Use Maximum Levels Displayed to keep the chart readable
6. Look for price areas where zones from multiple timeframes overlap —
these confluence zones carry the strongest significance
### Originality
This script is an original work combining multi-timeframe pivot detection with
a proximity-based level clustering algorithm. While pivot-based support and
resistance is a well-known concept, the specific implementation — simultaneous
four-timeframe scanning, the 1.5× zone width proximity filter, and the dynamic
support/resistance coloring based on current price — represents the author's
own approach to making multi-timeframe structure analysis practical and
readable on a live chart.
Script open-source
Dans l'esprit TradingView, le créateur de ce script l'a rendu open source afin que les traders puissent examiner et vérifier ses fonctionnalités. Bravo à l'auteur! Bien que vous puissiez l'utiliser gratuitement, n'oubliez pas que la republication du code est soumise à nos Règles.

Clause de non-responsabilité
Les informations et publications ne sont pas destinées à être, et ne constituent pas, des conseils ou recommandations financiers, d'investissement, de trading ou autres fournis ou approuvés par TradingView. Pour en savoir plus, consultez les Conditions d'utilisation.
Script open-source
Dans l'esprit TradingView, le créateur de ce script l'a rendu open source afin que les traders puissent examiner et vérifier ses fonctionnalités. Bravo à l'auteur! Bien que vous puissiez l'utiliser gratuitement, n'oubliez pas que la republication du code est soumise à nos Règles.
Clause de non-responsabilité
Les informations et publications ne sont pas destinées à être, et ne constituent pas, des conseils ou recommandations financiers, d'investissement, de trading ou autres fournis ou approuvés par TradingView. Pour en savoir plus, consultez les Conditions d'utilisation.