%R Trend Rev
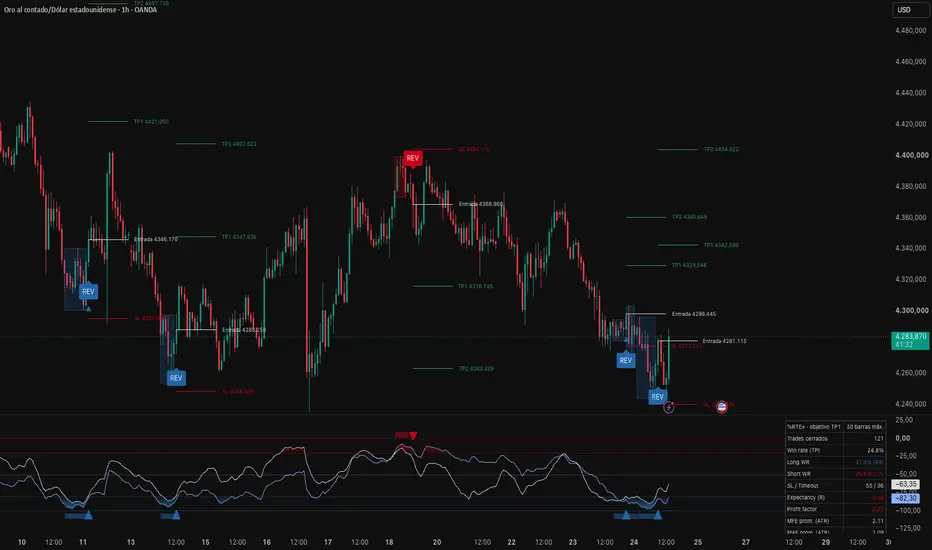
This script is an extended version of "%R Trend Exhaustion" by @upslidedown. Full credit to the original author for the dual Williams %R concept (fast 21 / slow 112) and the overbought/oversold exhaustion logic. This version keeps the original behavior available and adds signal-quality filters, trade levels and built-in performance statistics.
HOW IT WORKS
Two Williams %R lines (fast and slow) are calculated. When both are above -threshold the market is in an overbought trend; when both are below -100+threshold, an oversold trend. The original signal fires when price leaves that zone, suggesting the trend is exhausted.
WHAT'S NEW
1) Signal-quality filters (each can be toggled):
- Minimum time in zone: the zone must last at least N bars before its exit counts as a reversal. Removes 1–2 bar zone exits.
- Price confirmation: after the zone exit, the close must break the low (shorts) or high (longs) of the last N bars within a configurable window. The signal is cancelled if %R re-enters the zone.
- Internal divergence (optional): requires price to make a new extreme inside the zone while the fast %R fails to confirm it.
- Bar-close signals: signals are only confirmed on bar close to avoid intrabar repainting.
2) Higher-timeframe filter
Uses the slow %R from a higher timeframe (previous closed HTF bar, no lookahead repainting). Two modes: block signals against HTF extremes, or require HTF bias in the trade direction.
3) Trade levels
Each confirmed signal draws Entry, Stop Loss and two Take Profits. SL is placed beyond the OB/OS zone extreme plus an ATR buffer; TPs are R multiples. Alerts include these levels in the message.
4) Performance table
Tracks every confirmed signal until SL, TP or a max-bars timeout: win rate (total, long, short), expectancy in R, profit factor and average MFE/MAE in ATR. If SL and TP are hit in the same bar, it is counted as a loss (conservative). Use it to compare settings objectively on your instrument and timeframe.
5) Other improvements
Division-by-zero guard, OB/OS gradients linked to the threshold setting, consistent Average-formula mode, fixed zero-cross marker placement, and exit conditions for the TTS backtester signal (opposite signal or slow %R crossing -50).
HOW TO USE
Start with default settings, then turn filters on/off and watch the statistics table to see what each one contributes. The 112 slow period was originally tuned for crypto; validate it on your market before relying on it.
DISCLAIMER
The statistics are a simplified in-indicator simulation (no spread, commissions or slippage) and past results do not guarantee future performance. This is an analysis tool, not financial advice.
HOW IT WORKS
Two Williams %R lines (fast and slow) are calculated. When both are above -threshold the market is in an overbought trend; when both are below -100+threshold, an oversold trend. The original signal fires when price leaves that zone, suggesting the trend is exhausted.
WHAT'S NEW
1) Signal-quality filters (each can be toggled):
- Minimum time in zone: the zone must last at least N bars before its exit counts as a reversal. Removes 1–2 bar zone exits.
- Price confirmation: after the zone exit, the close must break the low (shorts) or high (longs) of the last N bars within a configurable window. The signal is cancelled if %R re-enters the zone.
- Internal divergence (optional): requires price to make a new extreme inside the zone while the fast %R fails to confirm it.
- Bar-close signals: signals are only confirmed on bar close to avoid intrabar repainting.
2) Higher-timeframe filter
Uses the slow %R from a higher timeframe (previous closed HTF bar, no lookahead repainting). Two modes: block signals against HTF extremes, or require HTF bias in the trade direction.
3) Trade levels
Each confirmed signal draws Entry, Stop Loss and two Take Profits. SL is placed beyond the OB/OS zone extreme plus an ATR buffer; TPs are R multiples. Alerts include these levels in the message.
4) Performance table
Tracks every confirmed signal until SL, TP or a max-bars timeout: win rate (total, long, short), expectancy in R, profit factor and average MFE/MAE in ATR. If SL and TP are hit in the same bar, it is counted as a loss (conservative). Use it to compare settings objectively on your instrument and timeframe.
5) Other improvements
Division-by-zero guard, OB/OS gradients linked to the threshold setting, consistent Average-formula mode, fixed zero-cross marker placement, and exit conditions for the TTS backtester signal (opposite signal or slow %R crossing -50).
HOW TO USE
Start with default settings, then turn filters on/off and watch the statistics table to see what each one contributes. The 112 slow period was originally tuned for crypto; validate it on your market before relying on it.
DISCLAIMER
The statistics are a simplified in-indicator simulation (no spread, commissions or slippage) and past results do not guarantee future performance. This is an analysis tool, not financial advice.

Clause de non-responsabilité
Les informations et publications ne sont pas destinées à être, et ne constituent pas, des conseils ou recommandations financiers, d'investissement, de trading ou autres fournis ou approuvés par TradingView. Pour en savoir plus, consultez les Conditions d'utilisation.
Clause de non-responsabilité
Les informations et publications ne sont pas destinées à être, et ne constituent pas, des conseils ou recommandations financiers, d'investissement, de trading ou autres fournis ou approuvés par TradingView. Pour en savoir plus, consultez les Conditions d'utilisation.