Dollar Bars
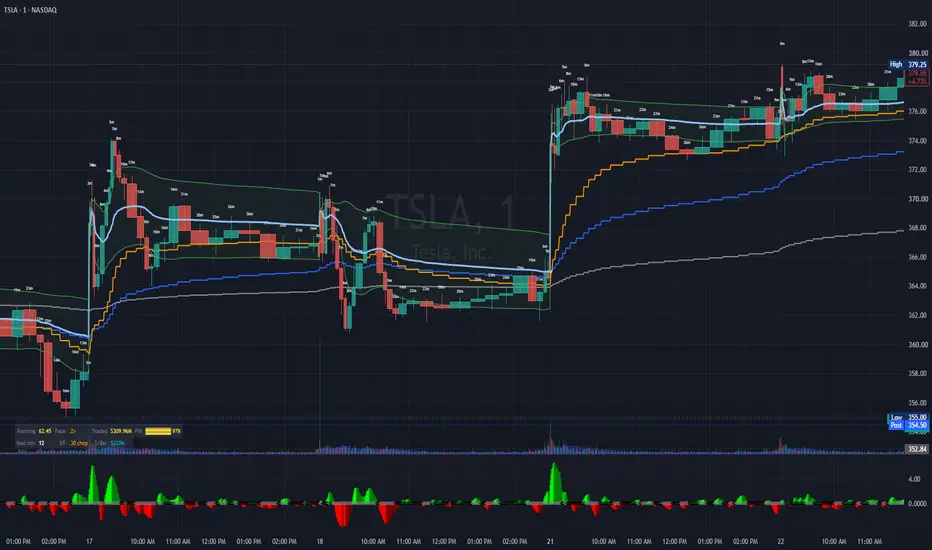
Most charts slice the market by the clock. This one slices by money: a new bar closes every time a fixed dollar amount has traded, however long that takes. Bars are narrow when capital is moving fast and wide when it isn't, and every bar carries the same weight in the moving averages regardless of how long it took to form.

Setup — two steps that matter
1. Put the chart on 1-minute. Dollar bars can only close on a native bar boundary, so the chart's timeframe is the finest resolution available to them. On a 15-minute chart every dollar bar would be some multiple of 15 minutes, which defeats the purpose. Use the lowest timeframe your plan allows.
2. Hide the native candles. Chart Settings → Symbol tab → uncheck Body, Borders, and Wick. Skip this and you are looking at two charts stacked on each other: the real 1-minute candles underneath and the dollar bars this script draws on top. This is the step people miss. The dollar bars are drawn objects and remain fully visible.
3. Adjust indicator settings. Set Market to match what you are charting — US Stocks for equities, Crypto for coins, Custom for futures and anything else. Then set Target Minutes per Bar to the cadence you want the Dollar Bars chart set to and read Median min in the stats panel. Dollar Bars works out the notional per bar needed to bring the median close to that figure. Set it to 15 and a typical bar takes about as long as a 15-minute candle — individual bars still run from seconds to an hour, which is the point.
Why it works this way
Every chart you have ever looked at slices the market by the clock. A 15-minute bar covers 15 minutes whether $2 million or $2 billion changed hands inside it. That means a dead lunch hour gets exactly as much weight in your moving averages as the opening drive.
This indicator slices by money instead. A new bar closes every time a fixed dollar amount has traded — say $300 million — however long that takes. When capital is moving, bars complete in seconds and appear narrow. When the tape goes quiet, a single bar can stretch across an hour.
Two consequences follow, and they are the whole point.
Every bar carries equal information. A 30-second flush and a 45-minute drift count the same. Quiet periods can no longer push an average around on thin volume, because quiet periods barely produce bars.
Bar width becomes a signal. Narrow bars mean money moved fast. Wide bars mean it didn't. That is a read on participation intensity you cannot get from a time chart, where every bar is the same width by construction.
This is not a new idea. Constant-notional sampling is well established in quantitative finance — Marcos López de Prado's Advances in Financial Machine Learning makes the case that dollar bars produce better-behaved return distributions than time bars do. It has simply never been available natively on TradingView.
Why dollars and not ticks
TradingView offers tick charts, which close a bar every N trades. That sounds similar but measures something different.
Tick charts count transactions, not size. Execution algorithms shred large orders into hundreds of small prints, so a name being worked quietly by a VWAP algo generates enormous trade counts on modest actual size. Tick bars therefore partly track how fragmented the order flow is — a market-structure artifact — rather than how much capital is moving.
Dollar bars count notional. A $300 million bar is $300 million whether it arrived in three block trades or three thousand odd lots. It also stays comparable across price levels and through splits, which neither tick counts nor share counts do.
The threshold, and how it is derived
The dollar amount per bar has to be set per symbol — $300 million is a sensible bar on one name and absurd on another. Rather than make you look that up, the script derives it from the symbol's own volume.
You tell it how long you want a typical bar to take. It converts recent daily dollar volume into a per-minute rate and multiplies by your target.
Rolling trailing (default) — every bar captures the trailing N-day calibration at its own open and holds it for that bar's life. Never goes stale, self-calibrates per symbol, renders full history. This is the mode for live charts, alerts, and watchlists: one alert configuration works across every symbol because nothing in it is an absolute number.
Frozen at anchor — derived once from the days before your anchor date, then fixed forever. Every bar on the chart represents the identical dollar amount, which is the property that makes bars comparable across months and regimes. This is the honest mode for research. Its weakness is staleness: a symbol whose volume doubles will have its bars sized by the old regime until you re-anchor.
Manual — you set the number. Use it when you want an exact, reproducible value. The stats panel shows a Recent figure — what the last N days imply right now — so you have the number to enter, and it turns orange when it has drifted more than 15% from what you are using.
Cadence adjustment — read this before tuning
Volume is not spread evenly through a session, so the average minute and the typical minute are different quantities. In equities the opening and closing auctions dump enormous notional in seconds, inflating the daily total and therefore the threshold, so ordinary intraday bars run long. Left uncorrected, a 15-minute target produces a median bar closer to 24 minutes.
The Cadence adjustment divides that out. 1.6 is typical for US large caps. Crypto has no auctions and trades around the clock, so its volume is flatter than the daily figure implies and the factor lands below 1 — 0.8 measured on BTC.
Both numbers are estimates and will be wrong for some symbols.
The field switches automatically with your Market selection, so the equity and crypto values are stored separately.
The stats panel
Bottom left, compact by default — two rows showing the bar currently forming: elapsed time, pace against the median, notional traded so far, and a fill gauge. Beneath that, the median duration, the efficiency ratio, and the dollar amount per bar.
Uncheck Compact for the full panel: five groups covering how the threshold was derived, what cadence your history actually produced, the live bar, regime and health state, and the last completed bar's OHLC with its fill time.
Hovering any bar shows the dollar bar's own open, high, low, close, start time, and elapsed minutes in the Data Window (Alt+D). The chart's own OHLC legend always shows the native 1-minute bar — the crosshair belongs to the platform and no script can redirect it.
Efficiency ratio
Net price movement divided by total distance traveled, computed on the dollar bar series.
On a time chart this measure conflates two situations: a quiet hour and an efficient hour both score high, because neither has much path. Here that ambiguity disappears. Since every bar holds dollars constant, the ratio reads as price progress per dollar of capital deployed. High means money is moving price directionally. Low means a great deal of money changed hands and price went nowhere — churn, absorption, someone being filled against resistance.
Optional background tint when it falls below your threshold. Off by default.
EMAs and alerts
Three EMAs computed on completed dollar bars only — blue, gray, and orange, lengths configurable. They advance when a bar closes, never on the 1-minute bars underneath.
Seven alert conditions, all evaluated on dollar-bar completion: price crossing your selected EMA in either direction, blue crossing gray in either direction, the efficiency ratio entering or leaving its choppy regime, and a plain new-bar notification.
Use Once Per Bar Close. Once Per Bar fires intrabar on a provisional value that can reverse before the minute ends.
For watchlist alerts: use Rolling with Daily average calibration. The alert stores your input values, not the derived threshold, so every symbol calibrates itself from its own volume. Avoid Manual for watchlists — it stores one literal dollar figure and applies it to every symbol in the list.
Limitations — stated plainly
This cannot be made into a strategy honestly. Pine resolves order fills on native bar boundaries, but dollar bars close inside a native bar. A backtest built on this would attribute entries and exits to the wrong price and time and produce a clean-looking report that lies to you. Use a proper research environment for that work. This is a visual and alerting instrument.
Only the most recent 500 bars are drawn. Pine caps boxes at 500. Scroll far enough back and you will find EMA lines over empty space. This affects the drawing only — the EMAs, the efficiency ratio, and every figure in the panel are computed from running state across the full history. The panel's Drawn row tells you the real count.
Alerts carry up to one native bar of latency. The condition becomes true when the dollar bar completes; delivery happens at the native bar close.
Intraday median calibration needs deep history — roughly lookback days × 390 native bars. Alert servers often load less, in which case it produces nothing. Daily average needs about 20 daily bars and works everywhere, which is why it is the default.
Nothing renders before the anchor date in Frozen mode. Pine runs strictly forward and cannot apply a threshold it has not yet computed.
Notes
Open source. Use it, fork it, improve it.
Bar durations are right-skewed — a floor near zero, no ceiling — so a handful of very wide bars pull the mean well above the median. Tune to the median, not the average, especially when comparing several symbols. Matching medians gives you charts whose typical bar is the same length; matching means does not, because the tails differ by symbol.
Feedback and bug reports welcome in the comments.
Content
Setup — two steps that matter
1. Put the chart on 1-minute. Dollar bars can only close on a native bar boundary, so the chart's timeframe is the finest resolution available to them. On a 15-minute chart every dollar bar would be some multiple of 15 minutes, which defeats the purpose. Use the lowest timeframe your plan allows.
2. Hide the native candles. Chart Settings → Symbol tab → uncheck Body, Borders, and Wick. Skip this and you are looking at two charts stacked on each other: the real 1-minute candles underneath and the dollar bars this script draws on top. This is the step people miss. The dollar bars are drawn objects and remain fully visible.
3. Adjust indicator settings. Set Market to match what you are charting — US Stocks for equities, Crypto for coins, Custom for futures and anything else. Then set Target Minutes per Bar to the cadence you want the Dollar Bars chart set to and read Median min in the stats panel. Dollar Bars works out the notional per bar needed to bring the median close to that figure. Set it to 15 and a typical bar takes about as long as a 15-minute candle — individual bars still run from seconds to an hour, which is the point.
Why it works this way
Every chart you have ever looked at slices the market by the clock. A 15-minute bar covers 15 minutes whether $2 million or $2 billion changed hands inside it. That means a dead lunch hour gets exactly as much weight in your moving averages as the opening drive.
This indicator slices by money instead. A new bar closes every time a fixed dollar amount has traded — say $300 million — however long that takes. When capital is moving, bars complete in seconds and appear narrow. When the tape goes quiet, a single bar can stretch across an hour.
Two consequences follow, and they are the whole point.
Every bar carries equal information. A 30-second flush and a 45-minute drift count the same. Quiet periods can no longer push an average around on thin volume, because quiet periods barely produce bars.
Bar width becomes a signal. Narrow bars mean money moved fast. Wide bars mean it didn't. That is a read on participation intensity you cannot get from a time chart, where every bar is the same width by construction.
This is not a new idea. Constant-notional sampling is well established in quantitative finance — Marcos López de Prado's Advances in Financial Machine Learning makes the case that dollar bars produce better-behaved return distributions than time bars do. It has simply never been available natively on TradingView.
Why dollars and not ticks
TradingView offers tick charts, which close a bar every N trades. That sounds similar but measures something different.
Tick charts count transactions, not size. Execution algorithms shred large orders into hundreds of small prints, so a name being worked quietly by a VWAP algo generates enormous trade counts on modest actual size. Tick bars therefore partly track how fragmented the order flow is — a market-structure artifact — rather than how much capital is moving.
Dollar bars count notional. A $300 million bar is $300 million whether it arrived in three block trades or three thousand odd lots. It also stays comparable across price levels and through splits, which neither tick counts nor share counts do.
The threshold, and how it is derived
The dollar amount per bar has to be set per symbol — $300 million is a sensible bar on one name and absurd on another. Rather than make you look that up, the script derives it from the symbol's own volume.
You tell it how long you want a typical bar to take. It converts recent daily dollar volume into a per-minute rate and multiplies by your target.
Rolling trailing (default) — every bar captures the trailing N-day calibration at its own open and holds it for that bar's life. Never goes stale, self-calibrates per symbol, renders full history. This is the mode for live charts, alerts, and watchlists: one alert configuration works across every symbol because nothing in it is an absolute number.
Frozen at anchor — derived once from the days before your anchor date, then fixed forever. Every bar on the chart represents the identical dollar amount, which is the property that makes bars comparable across months and regimes. This is the honest mode for research. Its weakness is staleness: a symbol whose volume doubles will have its bars sized by the old regime until you re-anchor.
Manual — you set the number. Use it when you want an exact, reproducible value. The stats panel shows a Recent figure — what the last N days imply right now — so you have the number to enter, and it turns orange when it has drifted more than 15% from what you are using.
Cadence adjustment — read this before tuning
Volume is not spread evenly through a session, so the average minute and the typical minute are different quantities. In equities the opening and closing auctions dump enormous notional in seconds, inflating the daily total and therefore the threshold, so ordinary intraday bars run long. Left uncorrected, a 15-minute target produces a median bar closer to 24 minutes.
The Cadence adjustment divides that out. 1.6 is typical for US large caps. Crypto has no auctions and trades around the clock, so its volume is flatter than the daily figure implies and the factor lands below 1 — 0.8 measured on BTC.
Both numbers are estimates and will be wrong for some symbols.
The field switches automatically with your Market selection, so the equity and crypto values are stored separately.
The stats panel
Bottom left, compact by default — two rows showing the bar currently forming: elapsed time, pace against the median, notional traded so far, and a fill gauge. Beneath that, the median duration, the efficiency ratio, and the dollar amount per bar.
Uncheck Compact for the full panel: five groups covering how the threshold was derived, what cadence your history actually produced, the live bar, regime and health state, and the last completed bar's OHLC with its fill time.
Hovering any bar shows the dollar bar's own open, high, low, close, start time, and elapsed minutes in the Data Window (Alt+D). The chart's own OHLC legend always shows the native 1-minute bar — the crosshair belongs to the platform and no script can redirect it.
Efficiency ratio
Net price movement divided by total distance traveled, computed on the dollar bar series.
On a time chart this measure conflates two situations: a quiet hour and an efficient hour both score high, because neither has much path. Here that ambiguity disappears. Since every bar holds dollars constant, the ratio reads as price progress per dollar of capital deployed. High means money is moving price directionally. Low means a great deal of money changed hands and price went nowhere — churn, absorption, someone being filled against resistance.
Optional background tint when it falls below your threshold. Off by default.
EMAs and alerts
Three EMAs computed on completed dollar bars only — blue, gray, and orange, lengths configurable. They advance when a bar closes, never on the 1-minute bars underneath.
Seven alert conditions, all evaluated on dollar-bar completion: price crossing your selected EMA in either direction, blue crossing gray in either direction, the efficiency ratio entering or leaving its choppy regime, and a plain new-bar notification.
Use Once Per Bar Close. Once Per Bar fires intrabar on a provisional value that can reverse before the minute ends.
For watchlist alerts: use Rolling with Daily average calibration. The alert stores your input values, not the derived threshold, so every symbol calibrates itself from its own volume. Avoid Manual for watchlists — it stores one literal dollar figure and applies it to every symbol in the list.
Limitations — stated plainly
This cannot be made into a strategy honestly. Pine resolves order fills on native bar boundaries, but dollar bars close inside a native bar. A backtest built on this would attribute entries and exits to the wrong price and time and produce a clean-looking report that lies to you. Use a proper research environment for that work. This is a visual and alerting instrument.
Only the most recent 500 bars are drawn. Pine caps boxes at 500. Scroll far enough back and you will find EMA lines over empty space. This affects the drawing only — the EMAs, the efficiency ratio, and every figure in the panel are computed from running state across the full history. The panel's Drawn row tells you the real count.
Alerts carry up to one native bar of latency. The condition becomes true when the dollar bar completes; delivery happens at the native bar close.
Intraday median calibration needs deep history — roughly lookback days × 390 native bars. Alert servers often load less, in which case it produces nothing. Daily average needs about 20 daily bars and works everywhere, which is why it is the default.
Nothing renders before the anchor date in Frozen mode. Pine runs strictly forward and cannot apply a threshold it has not yet computed.
Notes
Open source. Use it, fork it, improve it.
Bar durations are right-skewed — a floor near zero, no ceiling — so a handful of very wide bars pull the mean well above the median. Tune to the median, not the average, especially when comparing several symbols. Matching medians gives you charts whose typical bar is the same length; matching means does not, because the tails differ by symbol.
Feedback and bug reports welcome in the comments.
Content

Clause de non-responsabilité
Les informations et publications ne sont pas destinées à être, et ne constituent pas, des conseils ou recommandations financiers, d'investissement, de trading ou autres fournis ou approuvés par TradingView. Pour en savoir plus, consultez les Conditions d'utilisation.
Clause de non-responsabilité
Les informations et publications ne sont pas destinées à être, et ne constituent pas, des conseils ou recommandations financiers, d'investissement, de trading ou autres fournis ou approuvés par TradingView. Pour en savoir plus, consultez les Conditions d'utilisation.