OPEN-SOURCE SCRIPT
ZigZag with Real-Time Confirmation Stats
Slide 1: Title Slide
Title: Real-Time Confirmation Backtesting
Subtitle: Eliminating Look-Ahead Bias and Repainting Illusions in Swing Trading Indicators
Presenter / Author: Gogaz
Target Indicator: Pine Script v6 Advanced ZigZag Analysis
Slide 2: The Problem – The "ZigZag Illusion"Why Standard ZigZag Metrics Lie to YouThe Repainting Paradox: Standard ZigZag indicators draw lines retroactively from absolute low to absolute high.
The Execution Myth: Standard stats log profits starting from the absolute lowest bar (Bar 0).
The Harsh Reality: You cannot buy at Bar 0 because the indicator hasn't triggered yet
!The Danger: Backtests based on standard ZigZag create a false sense of high performance and mask severe strategy lag.
Key Takeaway: A strategy based on retroactive labels measures historical perfection, not tradeable edge.
Slide 3: The Solution – "Confirmation Time"
TrackingMeasuring Performance from the Moment of ActionShift in Metric Baseline: Instead of measuring gains from the absolute low, performance starts on the bar where the pivot actually confirms.Real-Time Data Capture: Logs the exact execution price (close) on the trigger bar.
Accounting for Lag: Converts indicator delay into a measurable metric called "Lag Cost."Realistic Risk Parameters: Stop-loss distances are measured from the entry bar back to the swing low, providing accurate Risk-to-Reward (R:R) ratios.
Slide 4: Side-by-Side ComparisonIdealized Performance vs. Real Tradeable EdgeMetric DimensionTheoretical (Standard)Confirmed (Our Approach)
Start PointAbsolute Swing Low / HighLive Confirmation Bar CloseLook-Ahead BiasHigh (Repaints retroactively)Zero (Bar-by-bar real-time)
Measured Move SizeFull Peak-to-Trough SwingRemaining Tradeable PortionSlippage & LagIgnored (Assumes 0 lag)Measured directly as Lag CostPractical UtilityChart visual aid onlyValid for Live Trading & Automation
Slide 5: The On-Chart Live Analytics Table
Instant Statistical Breakdown at a Glance
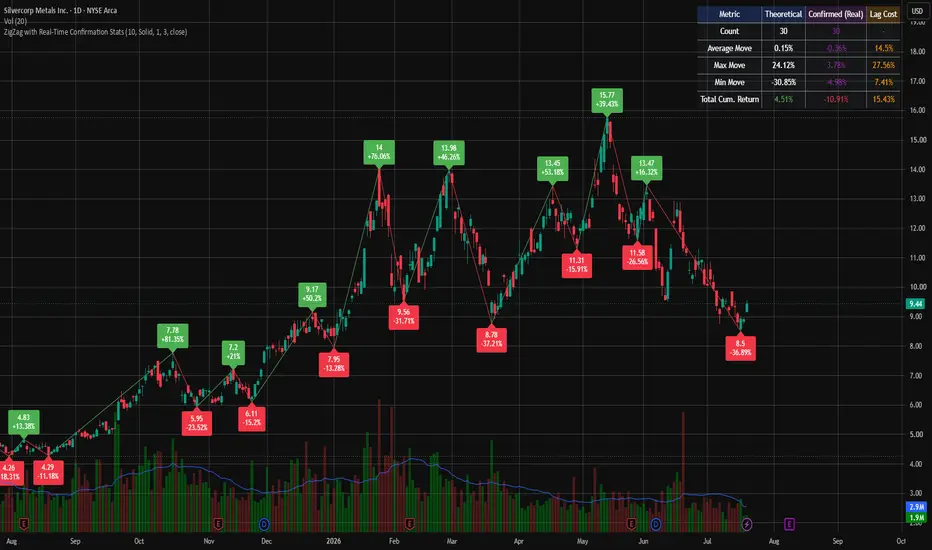
The script features a dynamic, real-time statistical dashboard fixed to the upper-right corner of your chart:
Count: Total confirmed swing legs evaluated across your custom date range.
Average Move: Compares peak-to-trough returns against actual captured returns.
Max / Min Move: Evaluates extreme market swings vs. actual real-time outcomes.
Total Cumulative Return: Demonstrates the cumulative difference between perfection and live execution.
Interactive Tooltips: Hovering over any cell reveals underlying math formulas and metric definitions.
Slide 6: Key Benefits & Strategic Use Cases
Parameter Optimization: Tune your ZigZag depth/period by finding the lowest Lag Cost without increasing false signals.
Realistic Backtesting: Feed realistic confirmation entry prices directly into strategy engines for accurate win rates.
Better Risk Management: Account for the "confirmation gap" between entry price and the swing pivot stop-loss.
FOR EDUCATIONAL USE ONLY....
NOT FINANCIAL ADVICE
Title: Real-Time Confirmation Backtesting
Subtitle: Eliminating Look-Ahead Bias and Repainting Illusions in Swing Trading Indicators
Presenter / Author: Gogaz
Target Indicator: Pine Script v6 Advanced ZigZag Analysis
Slide 2: The Problem – The "ZigZag Illusion"Why Standard ZigZag Metrics Lie to YouThe Repainting Paradox: Standard ZigZag indicators draw lines retroactively from absolute low to absolute high.
The Execution Myth: Standard stats log profits starting from the absolute lowest bar (Bar 0).
The Harsh Reality: You cannot buy at Bar 0 because the indicator hasn't triggered yet
!The Danger: Backtests based on standard ZigZag create a false sense of high performance and mask severe strategy lag.
Key Takeaway: A strategy based on retroactive labels measures historical perfection, not tradeable edge.
Slide 3: The Solution – "Confirmation Time"
TrackingMeasuring Performance from the Moment of ActionShift in Metric Baseline: Instead of measuring gains from the absolute low, performance starts on the bar where the pivot actually confirms.Real-Time Data Capture: Logs the exact execution price (close) on the trigger bar.
Accounting for Lag: Converts indicator delay into a measurable metric called "Lag Cost."Realistic Risk Parameters: Stop-loss distances are measured from the entry bar back to the swing low, providing accurate Risk-to-Reward (R:R) ratios.
Slide 4: Side-by-Side ComparisonIdealized Performance vs. Real Tradeable EdgeMetric DimensionTheoretical (Standard)Confirmed (Our Approach)
Start PointAbsolute Swing Low / HighLive Confirmation Bar CloseLook-Ahead BiasHigh (Repaints retroactively)Zero (Bar-by-bar real-time)
Measured Move SizeFull Peak-to-Trough SwingRemaining Tradeable PortionSlippage & LagIgnored (Assumes 0 lag)Measured directly as Lag CostPractical UtilityChart visual aid onlyValid for Live Trading & Automation
Slide 5: The On-Chart Live Analytics Table
Instant Statistical Breakdown at a Glance
The script features a dynamic, real-time statistical dashboard fixed to the upper-right corner of your chart:
Count: Total confirmed swing legs evaluated across your custom date range.
Average Move: Compares peak-to-trough returns against actual captured returns.
Max / Min Move: Evaluates extreme market swings vs. actual real-time outcomes.
Total Cumulative Return: Demonstrates the cumulative difference between perfection and live execution.
Interactive Tooltips: Hovering over any cell reveals underlying math formulas and metric definitions.
Slide 6: Key Benefits & Strategic Use Cases
Parameter Optimization: Tune your ZigZag depth/period by finding the lowest Lag Cost without increasing false signals.
Realistic Backtesting: Feed realistic confirmation entry prices directly into strategy engines for accurate win rates.
Better Risk Management: Account for the "confirmation gap" between entry price and the swing pivot stop-loss.
FOR EDUCATIONAL USE ONLY....
NOT FINANCIAL ADVICE
Script open-source
Dans l'esprit TradingView, le créateur de ce script l'a rendu open source afin que les traders puissent examiner et vérifier ses fonctionnalités. Bravo à l'auteur! Bien que vous puissiez l'utiliser gratuitement, n'oubliez pas que la republication du code est soumise à nos Règles.

Clause de non-responsabilité
Les informations et publications ne sont pas destinées à être, et ne constituent pas, des conseils ou recommandations financiers, d'investissement, de trading ou autres fournis ou approuvés par TradingView. Pour en savoir plus, consultez les Conditions d'utilisation.
Script open-source
Dans l'esprit TradingView, le créateur de ce script l'a rendu open source afin que les traders puissent examiner et vérifier ses fonctionnalités. Bravo à l'auteur! Bien que vous puissiez l'utiliser gratuitement, n'oubliez pas que la republication du code est soumise à nos Règles.
Clause de non-responsabilité
Les informations et publications ne sont pas destinées à être, et ne constituent pas, des conseils ou recommandations financiers, d'investissement, de trading ou autres fournis ou approuvés par TradingView. Pour en savoir plus, consultez les Conditions d'utilisation.