Mis à jour
Fib Grid Bias & Breakout
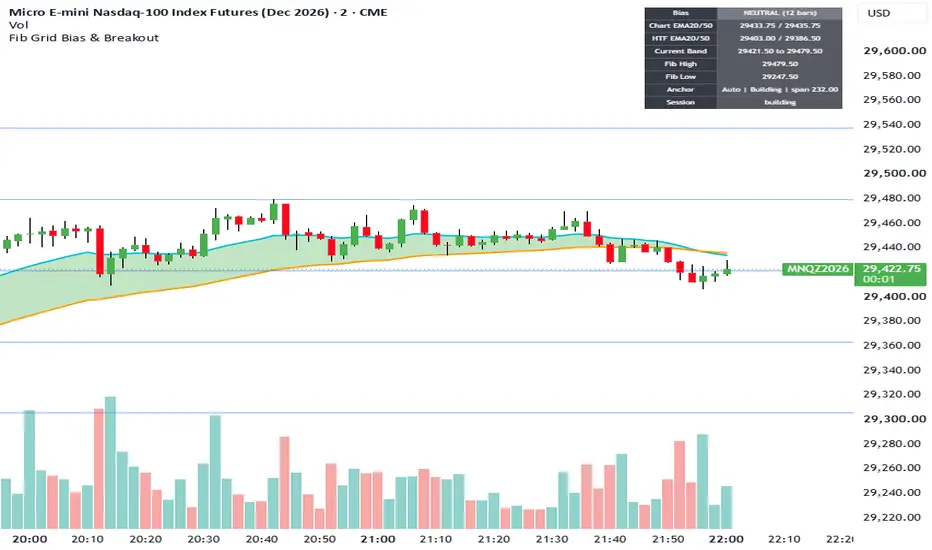
Builds a supply/demand grid from the overnight session rather than from swing structure. The idea is that the 18:00–00:00 ET window is where the market sets its reference range for the next day — the levels that matter are the ones institutions established overnight, not the ones a swing detector happens to pick up.
The three phases.
Building — from 18:00 ET, the indicator tracks the running high and low of every bar in the window. The range expands as the night goes.
Freeze — at midnight ET the range locks. Those two prices become the anchor for the whole next session.
Hold — through the following day, the frozen range is projected forward as a level grid.
Weekends. Friday 18:00 through Sunday 18:00 the grid stays blank. Carrying Friday's levels into a Sunday open is worse than having none — the gap invalidates them.
Thin-range padding. If the overnight range is too narrow to be useful (a quiet holiday session, say), the indicator pads it symmetrically to a minimum span around the midpoint. This keeps the grid from collapsing into a single line.
Reload robustness. If you load the chart mid-session — after the freeze has already happened — the indicator scans back through history to recover the overnight range instead of falling back to swing levels. Without this, a reload during the day would silently give you a different grid than the one you had open overnight.
Reading the row. The status line tells you which state you're in: Building, Frozen, or blank (weekend). If it says Frozen and the levels sit near the overnight range, it's working.
Example for students
Scenario. It's 18:00 ET on a Tuesday. ES is trading at some price P.
18:00–00:00 — Building. Price drifts between P − 8 and P + 11. The indicator's running high is P + 11, running low is P − 8. The row reads Building.
00:00 — Freeze. The range locks at P − 8 / P + 11. A 19-point range. The row flips to Frozen.
Wednesday session — Hold. The grid projects P − 8 and P + 11 forward. Price opens at P − 2, rallies to P + 9 — stalls just under the frozen high. That stall is the tradeable information: the overnight high is acting as resistance.
Why this beats a swing detector. A swing-based indicator would have drawn resistance at whatever the last local peak happened to be — maybe P + 6, maybe P + 14, depending on the lookback. The overnight anchor gives you one specific, non-arbitrary number that every participant watching the same session can see. That's what makes it a level rather than a line.
The teaching point. Levels aren't magic prices — they're places where a shared reference exists. The overnight range is shared because everyone watched the same window. That's the whole thesis.
The three phases.
Building — from 18:00 ET, the indicator tracks the running high and low of every bar in the window. The range expands as the night goes.
Freeze — at midnight ET the range locks. Those two prices become the anchor for the whole next session.
Hold — through the following day, the frozen range is projected forward as a level grid.
Weekends. Friday 18:00 through Sunday 18:00 the grid stays blank. Carrying Friday's levels into a Sunday open is worse than having none — the gap invalidates them.
Thin-range padding. If the overnight range is too narrow to be useful (a quiet holiday session, say), the indicator pads it symmetrically to a minimum span around the midpoint. This keeps the grid from collapsing into a single line.
Reload robustness. If you load the chart mid-session — after the freeze has already happened — the indicator scans back through history to recover the overnight range instead of falling back to swing levels. Without this, a reload during the day would silently give you a different grid than the one you had open overnight.
Reading the row. The status line tells you which state you're in: Building, Frozen, or blank (weekend). If it says Frozen and the levels sit near the overnight range, it's working.
Example for students
Scenario. It's 18:00 ET on a Tuesday. ES is trading at some price P.
18:00–00:00 — Building. Price drifts between P − 8 and P + 11. The indicator's running high is P + 11, running low is P − 8. The row reads Building.
00:00 — Freeze. The range locks at P − 8 / P + 11. A 19-point range. The row flips to Frozen.
Wednesday session — Hold. The grid projects P − 8 and P + 11 forward. Price opens at P − 2, rallies to P + 9 — stalls just under the frozen high. That stall is the tradeable information: the overnight high is acting as resistance.
Why this beats a swing detector. A swing-based indicator would have drawn resistance at whatever the last local peak happened to be — maybe P + 6, maybe P + 14, depending on the lookback. The overnight anchor gives you one specific, non-arbitrary number that every participant watching the same session can see. That's what makes it a level rather than a line.
The teaching point. Levels aren't magic prices — they're places where a shared reference exists. The overnight range is shared because everyone watched the same window. That's the whole thesis.
Notes de version
1. Lines extend left into history (optional) Two new settings under Fib Grid:Extend Lines Left (history) — off by default
Left Lookback (days) — default 30
Turn the toggle on and the fib lines reach back through prior sessions instead of starting one bar behind price. The lookback is capped at 5,000 bars, so on a 2-minute chart it saturates at roughly 7 days no matter what number you enter. On a 15-minute chart the same cap covers ~52 days.
2. Table is now fully configurable Three settings under Display:

Clause de non-responsabilité
Les informations et publications ne sont pas destinées à être, et ne constituent pas, des conseils ou recommandations financiers, d'investissement, de trading ou autres fournis ou approuvés par TradingView. Pour en savoir plus, consultez les Conditions d'utilisation.
Clause de non-responsabilité
Les informations et publications ne sont pas destinées à être, et ne constituent pas, des conseils ou recommandations financiers, d'investissement, de trading ou autres fournis ou approuvés par TradingView. Pour en savoir plus, consultez les Conditions d'utilisation.