OPEN-SOURCE SCRIPT
Mis à jour Grid Bot Demonstrator
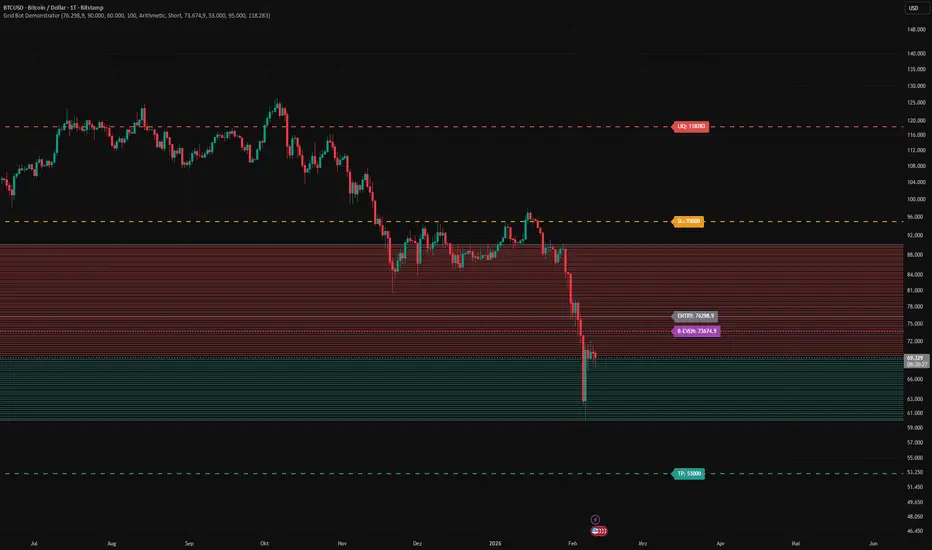
🚀 Grid Bot Demonstrator
Overview
The Grid Bot Demonstrator is a high-performance visualization tool designed for traders utilizing Grid Trading strategies (similar to Pionex, Binance, or KuCoin).
It allows you to simulate and visualize a grid bot's structure directly on your chart, enabling precise planning of ranges and grid density before deploying capital.
🛠 Key Features
* Dynamic Auto-Range: When limits are set to 0, the indicator automatically calculates an optimal range (±10% from current price) rounded to the nearest $10,000—ideal for Bitcoin’s psychological levels.
* Dual Mode Support: Seamlessly toggle between Long and Short strategies via a simple dropdown menu.
* Intelligent Grid Coloring:
Long Mode: Green lines above price (Take Profit), Red lines below (Buy/Support).
Short Mode: Red lines above price (Entry/Stop), Green lines below (Take Profit).
* Performance Optimized (Smart Window): Even with up to 500 grids, the chart remains fluid. The script renders only the 100 lines closest to the current price while maintaining perfect mathematical accuracy of the total grid count.
* Boundary Protection: Features bold, distinct safety lines for the Upper and Lower limits so you know exactly when your bot leaves the active trading zone.
📖 How to Use
1. Grid Settings Enter your Upper and Lower price limits. Use "0" for the automated 10k-rounding logic.
2. Grid Count Set the number of grids (up to 500) to match your bot's specific configuration.
3. Strategy Mode Select "Long" or "Short" to instantly adapt the color coding to your trade direction.
4. Scalability Works across all timeframes, from 1-minute scalping to daily charts.
🔬 Technical Specifications
* Grid Type: Arithmetic (Equal USD distance between levels).
* Engine: Pine Script V5 with max_lines_count optimization.
* Clarity: Focuses on visual price levels to provide a clean, distraction-free trading environment.
Overview
The Grid Bot Demonstrator is a high-performance visualization tool designed for traders utilizing Grid Trading strategies (similar to Pionex, Binance, or KuCoin).
It allows you to simulate and visualize a grid bot's structure directly on your chart, enabling precise planning of ranges and grid density before deploying capital.
🛠 Key Features
* Dynamic Auto-Range: When limits are set to 0, the indicator automatically calculates an optimal range (±10% from current price) rounded to the nearest $10,000—ideal for Bitcoin’s psychological levels.
* Dual Mode Support: Seamlessly toggle between Long and Short strategies via a simple dropdown menu.
* Intelligent Grid Coloring:
Long Mode: Green lines above price (Take Profit), Red lines below (Buy/Support).
Short Mode: Red lines above price (Entry/Stop), Green lines below (Take Profit).
* Performance Optimized (Smart Window): Even with up to 500 grids, the chart remains fluid. The script renders only the 100 lines closest to the current price while maintaining perfect mathematical accuracy of the total grid count.
* Boundary Protection: Features bold, distinct safety lines for the Upper and Lower limits so you know exactly when your bot leaves the active trading zone.
📖 How to Use
1. Grid Settings Enter your Upper and Lower price limits. Use "0" for the automated 10k-rounding logic.
2. Grid Count Set the number of grids (up to 500) to match your bot's specific configuration.
3. Strategy Mode Select "Long" or "Short" to instantly adapt the color coding to your trade direction.
4. Scalability Works across all timeframes, from 1-minute scalping to daily charts.
🔬 Technical Specifications
* Grid Type: Arithmetic (Equal USD distance between levels).
* Engine: Pine Script V5 with max_lines_count optimization.
* Clarity: Focuses on visual price levels to provide a clean, distraction-free trading environment.
Notes de version
v1.3 Bugfixes
Notes de version
v1.4Bugfixes
Notes de version
v1.7Bugfixes
Notes de version
v2.1Fine tuning of gap logic
Notes de version
v2.3 optimization of hysteresis
Notes de version
v2.4opacity fix
Notes de version
v2.5Liq price fixed
Notes de version
v3.4Bugfixes
Notes de version
v3.5added Break-Even
Notes de version
Grid Bot Demonstrator (v3.5)Grid Bot Demonstrator is a technical visualizer designed to act as a "digital twin" for Grid Trading Bots (specifically optimized for Pionex logic). It allows for precise planning, back-mapping, and real-time monitoring of grid strategies within the TradingView interface.
Core Functionalities: [] Pionex Engine Parity: Accurate calculation of Arithmetic and Geometric grid layouts. [] Bi-Directional Support: Toggle between Long and Short modes. * Hysteresis Filter: Simulates live exchange behavior by hiding grid lines too close to the current price.
Risk & Exit Monitoring (New Features): [] ENTRY Line: Solid marker showing your initial bot start price. [] B-EVEN (Break-Even): Dotted line to track your effective break-even point as it shifts through realized profits. [] TP / SL: Integrated Take Profit and Stop Loss markers with clear, color-coded labels. [] LIQ Marker ☠️: Visualizes your liquidation price to monitor leverage risk at a glance.
UI & UX Design: [] Right-Anchored Labels: All critical labels are pinned to the far right to keep the price action unobstructed. [] Muted Palette: Professional "Soft Color" scheme (Teal, Coral, Amber) for high legibility without eye strain. * Boundary Detection: Visual distinction between standard grid levels and the Upper/Lower limits.
Setup Instructions: [1] Enter your Upper and Lower Limits from your active bot. [2] Set the Grid Count and Spacing Type (Arithmetic or Geometric). [3] Input your Entry and current Breakeven Price from the Pionex app. [4] Optionally toggle Short Mode if you are running a Reverse or Short Grid.
Notes de version
v3.7added opacity option
Notes de version
v4Bugfixes
Notes de version
v4.1Bugfixes
Notes de version
v4.5added profit per grid incl. fees
Notes de version
v5.6added currency option - for previewing profit per grid
optimized grid line visibility to get closer to Pionex view
Notes de version
v5.9bugfixes
Notes de version
v6.7testet the integration of PnL feature with no success.
returned back to older stable version
Notes de version
v6.8added color selector for grids
Script open-source
Dans l'esprit TradingView, le créateur de ce script l'a rendu open source afin que les traders puissent examiner et vérifier ses fonctionnalités. Bravo à l'auteur! Bien que vous puissiez l'utiliser gratuitement, n'oubliez pas que la republication du code est soumise à nos Règles.

Clause de non-responsabilité
Les informations et publications ne sont pas destinées à être, et ne constituent pas, des conseils ou recommandations financiers, d'investissement, de trading ou autres fournis ou approuvés par TradingView. Pour en savoir plus, consultez les Conditions d'utilisation.
Script open-source
Dans l'esprit TradingView, le créateur de ce script l'a rendu open source afin que les traders puissent examiner et vérifier ses fonctionnalités. Bravo à l'auteur! Bien que vous puissiez l'utiliser gratuitement, n'oubliez pas que la republication du code est soumise à nos Règles.
Clause de non-responsabilité
Les informations et publications ne sont pas destinées à être, et ne constituent pas, des conseils ou recommandations financiers, d'investissement, de trading ou autres fournis ou approuvés par TradingView. Pour en savoir plus, consultez les Conditions d'utilisation.