OPEN-SOURCE SCRIPT
Extreme HMA ATR Bands
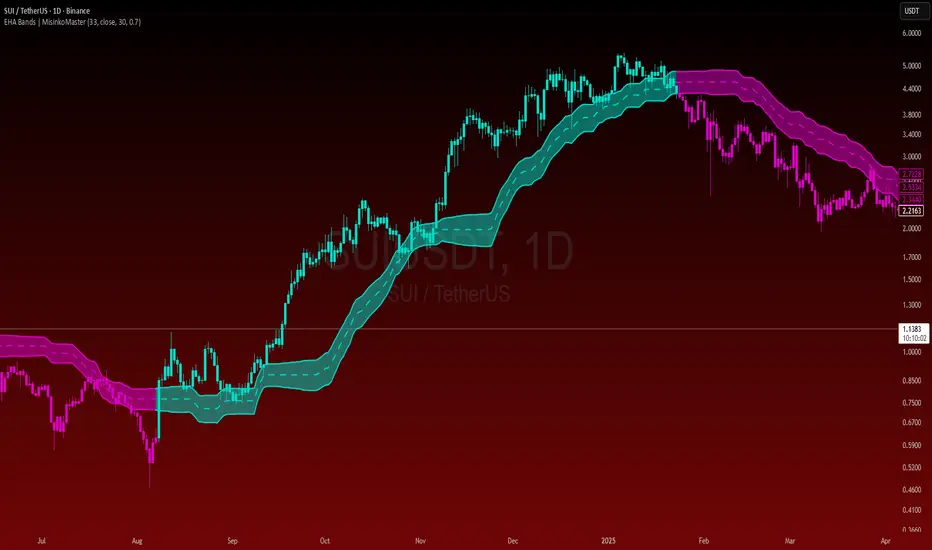
Extreme HMA ATR Bands
Extreme HMA ATR Bands are a fast and smooth trend-following tool designed to capture directional moves while minimizing false signals across volatile markets.
🚀 Benefits
• High responsiveness to market moves
• Smooth trend tracking with fewer false signals
• Strong performance on assets such as SOLUSD, SUIUSD, and CROUSD
• Clear visual band structure for easier market interpretation
💡 Core Idea
The indicator builds adaptive bands around a smoothed price structure derived from Hull-type processing. By focusing on extreme values and combining them into a balanced midpoint, the bands capture trend direction while maintaining smooth behavior.
ATR is then applied to dynamically scale the bands according to market volatility.
⚙️ How It Works
A fast-smoothed price series is calculated using Hull-style logic.
Highest and lowest values of this series are measured over multiple stages.
These extremes are processed again to balance responsiveness and smoothness.
The resulting midpoint forms the base trend line.
ATR is added and subtracted from this midpoint to generate adaptive upper and lower bands.
The result is a fast yet stable band structure that reacts efficiently to market direction changes.
📌 Usage Notes
• Price moving above the upper band suggests bullish pressure.
• Price moving below the lower band suggests bearish pressure.
• Band expansion signals increasing volatility.
• Band contraction often indicates consolidation phases.
Enjoy and trade smart.
Extreme HMA ATR Bands are a fast and smooth trend-following tool designed to capture directional moves while minimizing false signals across volatile markets.
🚀 Benefits
• High responsiveness to market moves
• Smooth trend tracking with fewer false signals
• Strong performance on assets such as SOLUSD, SUIUSD, and CROUSD
• Clear visual band structure for easier market interpretation
💡 Core Idea
The indicator builds adaptive bands around a smoothed price structure derived from Hull-type processing. By focusing on extreme values and combining them into a balanced midpoint, the bands capture trend direction while maintaining smooth behavior.
ATR is then applied to dynamically scale the bands according to market volatility.
⚙️ How It Works
A fast-smoothed price series is calculated using Hull-style logic.
Highest and lowest values of this series are measured over multiple stages.
These extremes are processed again to balance responsiveness and smoothness.
The resulting midpoint forms the base trend line.
ATR is added and subtracted from this midpoint to generate adaptive upper and lower bands.
The result is a fast yet stable band structure that reacts efficiently to market direction changes.
📌 Usage Notes
• Price moving above the upper band suggests bullish pressure.
• Price moving below the lower band suggests bearish pressure.
• Band expansion signals increasing volatility.
• Band contraction often indicates consolidation phases.
Enjoy and trade smart.
Script open-source
Dans l'esprit TradingView, le créateur de ce script l'a rendu open source afin que les traders puissent examiner et vérifier ses fonctionnalités. Bravo à l'auteur! Bien que vous puissiez l'utiliser gratuitement, n'oubliez pas que la republication du code est soumise à nos Règles.

"Better to take a step back, than to stand stuck forever."
Clause de non-responsabilité
Les informations et publications ne sont pas destinées à être, et ne constituent pas, des conseils ou recommandations financiers, d'investissement, de trading ou autres fournis ou approuvés par TradingView. Pour en savoir plus, consultez les Conditions d'utilisation.
Script open-source
Dans l'esprit TradingView, le créateur de ce script l'a rendu open source afin que les traders puissent examiner et vérifier ses fonctionnalités. Bravo à l'auteur! Bien que vous puissiez l'utiliser gratuitement, n'oubliez pas que la republication du code est soumise à nos Règles.
"Better to take a step back, than to stand stuck forever."
Clause de non-responsabilité
Les informations et publications ne sont pas destinées à être, et ne constituent pas, des conseils ou recommandations financiers, d'investissement, de trading ou autres fournis ou approuvés par TradingView. Pour en savoir plus, consultez les Conditions d'utilisation.