Easy Mode Oscillator v3.1 Macro Regime
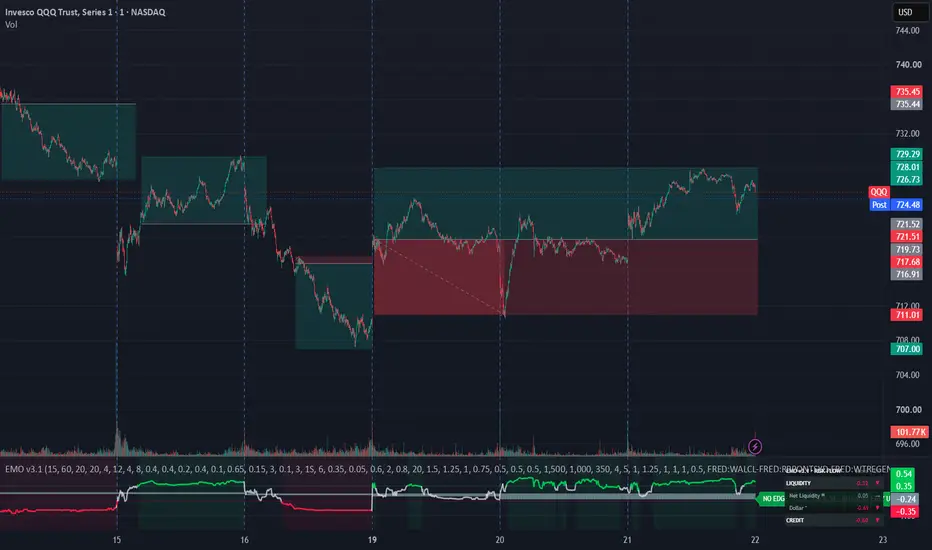
Easy Mode Oscillator v3.1 — User Guide
Easy Mode Oscillator combines a broader market regime with an intraday trend reading to help you understand whether market conditions support upward movement, downward movement, or neither direction clearly.
The indicator evaluates two horizons:
• Strategic Regime: The broader market backdrop, built from daily and weekly data.
• Intraday Engine: The current session’s conditions, using market internals, benchmark price behavior, sector participation, volatility, and cross-market relationships.
The default configuration focuses on US equity conditions. Its benchmark is SPY, and its supporting factors use their own configured symbols. Adding the indicator to another chart does not automatically change those inputs.
Read the strategic regime first, then compare it with the intraday state.
• EASY BULL means the strategic model has qualified a bullish regime.
• EASY BEAR means the strategic model has qualified a bearish regime.
• NO EDGE means neither strategic direction currently meets the model’s requirements.
• INTRADAY EASY UP means the session engine has qualified bullish conditions.
• INTRADAY EASY DOWN means the session engine has qualified bearish conditions.
When both horizons agree, the indicator describes that alignment as EASY²:
• EASY² BULL: The strategic regime and intraday state are both bullish.
• EASY² BEAR: The strategic regime and intraday state are both bearish.
• PULLBACK: The strategic regime is bullish while the intraday state is bearish.
• BOUNCE: The strategic regime is bearish while the intraday state is bullish.
PULLBACK and BOUNCE describe disagreement between the two horizons. They do not establish that the opposing move will reverse. A pullback can develop into a larger decline, and a bounce can develop into a sustained recovery.
The intraday engine can also qualify a direction while the strategic regime shows NO EDGE. This represents an independent intraday reading without alignment from the broader regime.
The scores measure the strength and direction of the model’s evidence. Positive values support a bullish equity interpretation, negative values support a bearish interpretation, and readings near zero indicate weaker or offsetting evidence.
A score of +0.70 does not mean a 70% probability of success. Strong positive or negative readings are also not automatically overbought or oversold signals.
The strategic model evaluates six groups of information:
• Liquidity: Movement in the configured net-liquidity series.
• Credit: High-yield credit spreads and the relationship between HYG and IEF.
• Volatility: VIX and the VIX/VIX3M relationship, incorporating both movement and absolute levels.
• Cross-Asset: The Dollar Index, Copper/Gold, AUD/JPY, and optional Bitcoin.
• Equity Appetite: Consumer discretionary versus staples, high-beta versus low-volatility stocks, and optional breadth.
• Macro Pulse: Initial unemployment claims.
Strategic movement scores combine direction, impulse, and persistence. Direction compares faster and slower trends. Impulse measures the size of recent movement relative to typical variation. Persistence measures how consistently changes occur in one direction.
The default component mix is 40% direction, 40% impulse, and 20% persistence.
The intraday engine evaluates seven groups:
• Internals: Advance/decline net, NYSE TICK, and the up/down volume ratio. These describe the breadth and balance of buying and selling.
• Tape: SPY’s position relative to session VWAP, time spent on either side of VWAP, and VWAP slope.
• Participation: Whether the configured sector ETFs are above or below their own session VWAP.
• Volatility: VIX movement and changes in the VIX/VIX3M relationship.
• Cross-Asset: Dollar Index, Copper/Gold, AUD/JPY, and Bitcoin.
• Credit: Session movement in HYG relative to IEF.
• Appetite: Session movement in XLY/XLP and SPHB/SPLV.
VWAP is the volume-weighted average price for the session. The Tape and Participation groups use it to assess whether the benchmark and its supporting sectors are holding above or below their session reference points.
The default intraday block weights are:
• Internals: 1.50
• Tape: 1.25
• Participation: 1.00
• Volatility: 0.75
• Cross-Asset: 0.50
• Credit: 0.50
• Appetite: 0.50
The extended intraday factors measure movement from the prior session close relative to each instrument’s typical session move. The documented calculation adjusts for elapsed session time, allowing early movement to register more clearly. This also makes those readings more sensitive early in the session.
Their default lookback is 20 sessions. Each extended factor requires at least five completed sessions of scale data before becoming available.
A directional state requires more than a positive or negative score. The model also checks strength, agreement between blocks, and consecutive qualifying evaluations.
The default strategic settings are:
• Bullish entry threshold: +0.40
• Bearish entry threshold: −0.40
• Block agreement requirement: 65%
• Confirmation count: 3
• Bullish exit threshold: +0.10
• Bearish exit threshold: −0.10
The default intraday settings are:
• Bullish entry threshold: +0.35
• Bearish entry threshold: −0.35
• Block agreement requirement: 60%
• Confirmation count: 2
• Bullish exit threshold: +0.05
• Bearish exit threshold: −0.05
The separate entry and exit thresholds allow an established state to persist through smaller fluctuations. For example, an active intraday bullish state can remain active when its score falls from +0.40 to +0.20, provided agreement remains sufficient. It clears when the score reaches +0.05 or lower, or when agreement deteriorates enough to trigger an exit.
With all seven intraday blocks available, the 60% agreement requirement needs five agreeing blocks. Four out of seven is approximately 57%, which does not qualify.
Block weights affect influence on the composite. Agreement measures participation across blocks. Increasing one block’s weight does not give it additional agreement votes.
For initial setup, use a standard 5-minute chart with the Intraday Timeframe set to 5 minutes. Keep the chart timeframe at or below the intraday engine timeframe to preserve more of the engine’s detail.
The default session warmup is six engine bars. At five minutes per bar, this represents 30 minutes. Warmup establishes when the engine becomes eligible to qualify a state; it does not guarantee a signal exactly 30 minutes after the open.
The documented session design resets the intraday state at the open and returns it to neutral when the benchmark stops providing fresh bars. The overnight movement of 24-hour factors can inform the next equity session, but does not independently keep the intraday state active.
A practical reading routine is:
1. Check that the configured feeds are available and have sufficient history.
2. Identify the strategic regime.
3. Allow the intraday session to warm up.
4. Compare the intraday state with the strategic direction.
5. Inspect which blocks support or oppose the composite.
6. Reassess when either state changes.
The factor table is intended to help explain what is driving the reading. The display settings also include the intraday composite, alignment markers, optional strategic block plots, and table positioning.
Begin with the default settings while learning the indicator. Higher entry thresholds and additional confirmation generally make activation more selective. More smoothing slows changes. Adjust one setting at a time so you can understand its effect.
A neutral reading can reflect insufficient strength, disagreement, session warmup, or unavailable data. It does not necessarily mean the market is ranging. Likewise, a directional state provides context without specifying an entry price, stop, target, or position size.
This version’s documentation describes synthetic testing of the older core. Those results do not establish live trading performance, and the added v3.1 factors and combined session model have not undergone the same reported testing.
The indicator is designed around completed source bars, so readings involve delay. Exact alert behavior, historical versus live consistency, and non-repainting behavior require verification against the complete implementation.
Easy Mode Oscillator combines a broader market regime with an intraday trend reading to help you understand whether market conditions support upward movement, downward movement, or neither direction clearly.
The indicator evaluates two horizons:
• Strategic Regime: The broader market backdrop, built from daily and weekly data.
• Intraday Engine: The current session’s conditions, using market internals, benchmark price behavior, sector participation, volatility, and cross-market relationships.
The default configuration focuses on US equity conditions. Its benchmark is SPY, and its supporting factors use their own configured symbols. Adding the indicator to another chart does not automatically change those inputs.
Read the strategic regime first, then compare it with the intraday state.
• EASY BULL means the strategic model has qualified a bullish regime.
• EASY BEAR means the strategic model has qualified a bearish regime.
• NO EDGE means neither strategic direction currently meets the model’s requirements.
• INTRADAY EASY UP means the session engine has qualified bullish conditions.
• INTRADAY EASY DOWN means the session engine has qualified bearish conditions.
When both horizons agree, the indicator describes that alignment as EASY²:
• EASY² BULL: The strategic regime and intraday state are both bullish.
• EASY² BEAR: The strategic regime and intraday state are both bearish.
• PULLBACK: The strategic regime is bullish while the intraday state is bearish.
• BOUNCE: The strategic regime is bearish while the intraday state is bullish.
PULLBACK and BOUNCE describe disagreement between the two horizons. They do not establish that the opposing move will reverse. A pullback can develop into a larger decline, and a bounce can develop into a sustained recovery.
The intraday engine can also qualify a direction while the strategic regime shows NO EDGE. This represents an independent intraday reading without alignment from the broader regime.
The scores measure the strength and direction of the model’s evidence. Positive values support a bullish equity interpretation, negative values support a bearish interpretation, and readings near zero indicate weaker or offsetting evidence.
A score of +0.70 does not mean a 70% probability of success. Strong positive or negative readings are also not automatically overbought or oversold signals.
The strategic model evaluates six groups of information:
• Liquidity: Movement in the configured net-liquidity series.
• Credit: High-yield credit spreads and the relationship between HYG and IEF.
• Volatility: VIX and the VIX/VIX3M relationship, incorporating both movement and absolute levels.
• Cross-Asset: The Dollar Index, Copper/Gold, AUD/JPY, and optional Bitcoin.
• Equity Appetite: Consumer discretionary versus staples, high-beta versus low-volatility stocks, and optional breadth.
• Macro Pulse: Initial unemployment claims.
Strategic movement scores combine direction, impulse, and persistence. Direction compares faster and slower trends. Impulse measures the size of recent movement relative to typical variation. Persistence measures how consistently changes occur in one direction.
The default component mix is 40% direction, 40% impulse, and 20% persistence.
The intraday engine evaluates seven groups:
• Internals: Advance/decline net, NYSE TICK, and the up/down volume ratio. These describe the breadth and balance of buying and selling.
• Tape: SPY’s position relative to session VWAP, time spent on either side of VWAP, and VWAP slope.
• Participation: Whether the configured sector ETFs are above or below their own session VWAP.
• Volatility: VIX movement and changes in the VIX/VIX3M relationship.
• Cross-Asset: Dollar Index, Copper/Gold, AUD/JPY, and Bitcoin.
• Credit: Session movement in HYG relative to IEF.
• Appetite: Session movement in XLY/XLP and SPHB/SPLV.
VWAP is the volume-weighted average price for the session. The Tape and Participation groups use it to assess whether the benchmark and its supporting sectors are holding above or below their session reference points.
The default intraday block weights are:
• Internals: 1.50
• Tape: 1.25
• Participation: 1.00
• Volatility: 0.75
• Cross-Asset: 0.50
• Credit: 0.50
• Appetite: 0.50
The extended intraday factors measure movement from the prior session close relative to each instrument’s typical session move. The documented calculation adjusts for elapsed session time, allowing early movement to register more clearly. This also makes those readings more sensitive early in the session.
Their default lookback is 20 sessions. Each extended factor requires at least five completed sessions of scale data before becoming available.
A directional state requires more than a positive or negative score. The model also checks strength, agreement between blocks, and consecutive qualifying evaluations.
The default strategic settings are:
• Bullish entry threshold: +0.40
• Bearish entry threshold: −0.40
• Block agreement requirement: 65%
• Confirmation count: 3
• Bullish exit threshold: +0.10
• Bearish exit threshold: −0.10
The default intraday settings are:
• Bullish entry threshold: +0.35
• Bearish entry threshold: −0.35
• Block agreement requirement: 60%
• Confirmation count: 2
• Bullish exit threshold: +0.05
• Bearish exit threshold: −0.05
The separate entry and exit thresholds allow an established state to persist through smaller fluctuations. For example, an active intraday bullish state can remain active when its score falls from +0.40 to +0.20, provided agreement remains sufficient. It clears when the score reaches +0.05 or lower, or when agreement deteriorates enough to trigger an exit.
With all seven intraday blocks available, the 60% agreement requirement needs five agreeing blocks. Four out of seven is approximately 57%, which does not qualify.
Block weights affect influence on the composite. Agreement measures participation across blocks. Increasing one block’s weight does not give it additional agreement votes.
For initial setup, use a standard 5-minute chart with the Intraday Timeframe set to 5 minutes. Keep the chart timeframe at or below the intraday engine timeframe to preserve more of the engine’s detail.
The default session warmup is six engine bars. At five minutes per bar, this represents 30 minutes. Warmup establishes when the engine becomes eligible to qualify a state; it does not guarantee a signal exactly 30 minutes after the open.
The documented session design resets the intraday state at the open and returns it to neutral when the benchmark stops providing fresh bars. The overnight movement of 24-hour factors can inform the next equity session, but does not independently keep the intraday state active.
A practical reading routine is:
1. Check that the configured feeds are available and have sufficient history.
2. Identify the strategic regime.
3. Allow the intraday session to warm up.
4. Compare the intraday state with the strategic direction.
5. Inspect which blocks support or oppose the composite.
6. Reassess when either state changes.
The factor table is intended to help explain what is driving the reading. The display settings also include the intraday composite, alignment markers, optional strategic block plots, and table positioning.
Begin with the default settings while learning the indicator. Higher entry thresholds and additional confirmation generally make activation more selective. More smoothing slows changes. Adjust one setting at a time so you can understand its effect.
A neutral reading can reflect insufficient strength, disagreement, session warmup, or unavailable data. It does not necessarily mean the market is ranging. Likewise, a directional state provides context without specifying an entry price, stop, target, or position size.
This version’s documentation describes synthetic testing of the older core. Those results do not establish live trading performance, and the added v3.1 factors and combined session model have not undergone the same reported testing.
The indicator is designed around completed source bars, so readings involve delay. Exact alert behavior, historical versus live consistency, and non-repainting behavior require verification against the complete implementation.

Clause de non-responsabilité
Les informations et publications ne sont pas destinées à être, et ne constituent pas, des conseils ou recommandations financiers, d'investissement, de trading ou autres fournis ou approuvés par TradingView. Pour en savoir plus, consultez les Conditions d'utilisation.
Clause de non-responsabilité
Les informations et publications ne sont pas destinées à être, et ne constituent pas, des conseils ou recommandations financiers, d'investissement, de trading ou autres fournis ou approuvés par TradingView. Pour en savoir plus, consultez les Conditions d'utilisation.