OPEN-SOURCE SCRIPT
Phantom Flow Decoder [JOAT]
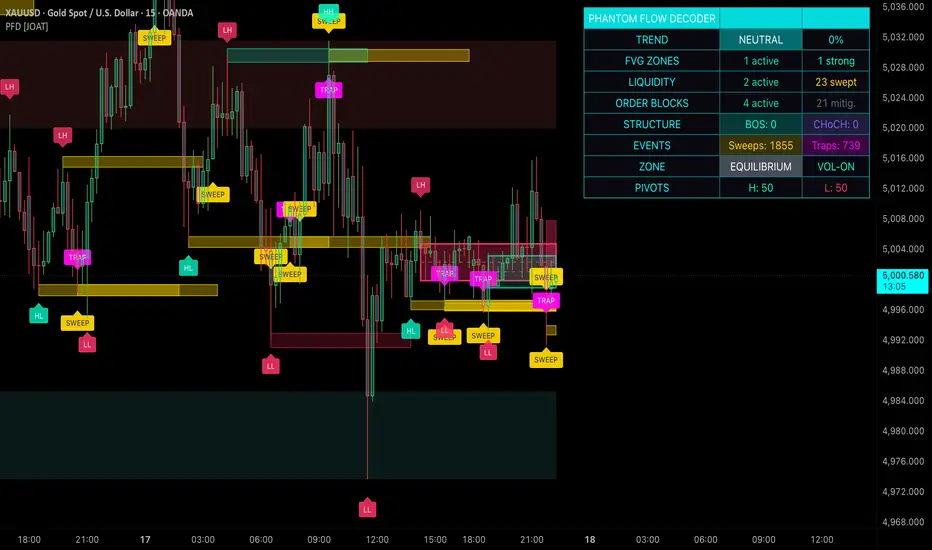
Phantom Flow Decoder
Introduction
The Phantom Flow Decoder is an open-source overlay indicator that brings together five core Smart Money Concepts into a single, cohesive tool: market structure detection (BOS/CHoCH), order block identification, liquidity pool tracking with sweep and trap detection, Fair Value Gap (FVG) analysis with consequent encroachment, and premium/discount zone mapping. Rather than toggling between multiple scripts, traders can observe how these institutional concepts interact on the same chart in real time.
The indicator is built with Pine Script v6 and uses custom user-defined types to manage every structural element as a self-contained object, keeping the codebase modular and the chart clean even when all features are enabled simultaneously.

Why This Indicator Exists
Most Smart Money Concept tools on TradingView focus on a single element, such as order blocks alone or FVGs alone. This forces traders to stack multiple concepts and mentally piece together the relationships between them. The Phantom Flow Decoder solves this by synthesizing these elements into one unified system where:
Core Components Explained
1. Market Structure Detection (BOS and CHoCH)
The indicator uses pivot-based swing detection to identify Higher Highs (HH), Lower Lows (LL), Higher Lows (HL), and Lower Highs (LH). When price breaks a previous swing level, the script classifies it as either a Break of Structure (BOS), which continues the existing trend, or a Change of Character (CHoCH), which signals a potential trend reversal.
Structure strength is calculated by combining volume ratio and price movement relative to ATR. A BOS with high volume and a large price move relative to ATR is considered stronger than one with thin volume.
Pine Script®
Each structure break is drawn as a horizontal line extending from the break level, with a compact label ("BOS" or "CHoCH") positioned nearby. Line styles are configurable between solid, dashed, and dotted.
Overview showing BOS and CHoCH labels on the chart with structure lines extending from break points
2. Order Block Detection
Order blocks represent the last opposing candle before a significant move. The indicator identifies bullish order blocks as the last bearish candle before a swing low, and bearish order blocks as the last bullish candle before a swing high. To filter noise, order blocks must meet a minimum size threshold measured in ATR multiples (default 0.5x ATR).
Each order block is drawn as a semi-transparent box with a dashed equilibrium line at its midpoint. When price returns to an order block and penetrates through it, the block is marked as mitigated and its visual is removed from the chart, keeping the display uncluttered.
3. Liquidity Pool Detection with Sweeps and Traps
Liquidity pools form at swing points where stop orders are likely clustered. The indicator tracks these pools and monitors them for two key events:
When volume-weighted liquidity is enabled, each pool carries a weight based on the volume at the swing point relative to the 20-period volume SMA. This helps traders prioritize pools where significant participation occurred.
4. Fair Value Gap (FVG) Analysis
A bullish FVG forms when the current bar's low is above the high from two bars ago, creating a gap in price delivery. A bearish FVG is the inverse. The indicator filters FVGs by a minimum size (default 0.3x ATR) to avoid plotting insignificant gaps.
Each FVG is drawn as a colored box. When Consequent Encroachment is enabled, a dashed line is drawn at the 50% level of the gap, which institutional traders often use as a precise entry point. FVGs are tracked for mitigation: when price fills the gap, the box style changes to indicate it has been mitigated. FVGs older than the configurable max age (default 50 bars) are automatically removed.
5. Premium/Discount Zones
Using a configurable lookback period (default 50 bars), the indicator calculates the highest high and lowest low, then divides the range into zones. The top 20% is the premium zone (where sellers have an edge), the bottom 20% is the discount zone (where buyers have an edge), and the 50% level is the equilibrium. These zones are drawn as semi-transparent boxes with an equilibrium line.

Visual Elements
Input Parameters
Structure Detection:
Order Block Detection:
Liquidity Detection:
Fair Value Gaps:
Premium/Discount Zones:
How to Use This Indicator
Step 1: Identify the current market structure by observing BOS/CHoCH labels. A series of bullish BOS confirms an uptrend; a bearish CHoCH warns of a potential reversal.
Step 2: Look for unmitigated order blocks in the direction of the trend. In an uptrend, focus on bullish OBs below current price as potential support zones.
Step 3: Check if any FVGs overlap with order blocks. This confluence of an institutional entry zone (OB) with an imbalance in price delivery (FVG) creates a high-probability area.
Step 4: Confirm the zone is in the discount area (for longs) or premium area (for shorts) using the premium/discount zones.
Step 5: Monitor liquidity pools for sweeps. A sweep of a liquidity pool followed by a reversal into a confluence zone is a classic institutional entry pattern.
Step 6: Use the dashboard to monitor overall market conditions and structure counts.
Example showing a confluence setup: FVG overlapping with an order block in the discount zone, with a nearby liquidity sweep
Indicator Limitations

Originality Statement
This indicator is original in its unified integration approach. While individual SMC components (BOS, CHoCH, order blocks, FVGs, liquidity pools) exist in separate scripts, this indicator is justified because:
Disclaimer
This indicator is provided for educational and informational purposes only. It is not financial advice or a recommendation to buy or sell any financial instrument. Trading involves substantial risk of loss and is not suitable for all investors. Smart Money Concepts are analytical frameworks that help interpret market behavior, but they do not guarantee profitable trades. Past patterns do not guarantee future results. Always use proper risk management, including stop losses and position sizing appropriate for your account. The author is not responsible for any losses incurred from using this indicator.
-Made with passion by officialjackofalltrades
Introduction
The Phantom Flow Decoder is an open-source overlay indicator that brings together five core Smart Money Concepts into a single, cohesive tool: market structure detection (BOS/CHoCH), order block identification, liquidity pool tracking with sweep and trap detection, Fair Value Gap (FVG) analysis with consequent encroachment, and premium/discount zone mapping. Rather than toggling between multiple scripts, traders can observe how these institutional concepts interact on the same chart in real time.
The indicator is built with Pine Script v6 and uses custom user-defined types to manage every structural element as a self-contained object, keeping the codebase modular and the chart clean even when all features are enabled simultaneously.
Why This Indicator Exists
Most Smart Money Concept tools on TradingView focus on a single element, such as order blocks alone or FVGs alone. This forces traders to stack multiple concepts and mentally piece together the relationships between them. The Phantom Flow Decoder solves this by synthesizing these elements into one unified system where:
- Structure breaks validate order blocks: An order block only forms when a confirmed pivot is detected, ensuring the OB has structural significance.
- Liquidity pools are volume-weighted: Pools are not just swing points; they carry a volume weight that reflects how much participation occurred at that level.
- FVGs are tracked through their lifecycle: From formation to mitigation, each gap is monitored and visually updated when price fills it.
- Premium/discount zones provide context: Knowing whether price sits in the top 20% or bottom 20% of the recent range helps traders decide whether to look for longs or shorts.
Core Components Explained
1. Market Structure Detection (BOS and CHoCH)
The indicator uses pivot-based swing detection to identify Higher Highs (HH), Lower Lows (LL), Higher Lows (HL), and Lower Highs (LH). When price breaks a previous swing level, the script classifies it as either a Break of Structure (BOS), which continues the existing trend, or a Change of Character (CHoCH), which signals a potential trend reversal.
Structure strength is calculated by combining volume ratio and price movement relative to ATR. A BOS with high volume and a large price move relative to ATR is considered stronger than one with thin volume.
Each structure break is drawn as a horizontal line extending from the break level, with a compact label ("BOS" or "CHoCH") positioned nearby. Line styles are configurable between solid, dashed, and dotted.
Overview showing BOS and CHoCH labels on the chart with structure lines extending from break points
2. Order Block Detection
Order blocks represent the last opposing candle before a significant move. The indicator identifies bullish order blocks as the last bearish candle before a swing low, and bearish order blocks as the last bullish candle before a swing high. To filter noise, order blocks must meet a minimum size threshold measured in ATR multiples (default 0.5x ATR).
Each order block is drawn as a semi-transparent box with a dashed equilibrium line at its midpoint. When price returns to an order block and penetrates through it, the block is marked as mitigated and its visual is removed from the chart, keeping the display uncluttered.
3. Liquidity Pool Detection with Sweeps and Traps
Liquidity pools form at swing points where stop orders are likely clustered. The indicator tracks these pools and monitors them for two key events:
- Sweeps: When price briefly pierces a liquidity level and then reverses, the pool is marked with a gold "SWEEP" label. The sweep threshold is configurable in ATR multiples.
- Traps: When a sweep occurs with abnormally high volume, it is classified as a Smart Money Trap and marked with a magenta "TRAP" label, suggesting institutional manipulation.
When volume-weighted liquidity is enabled, each pool carries a weight based on the volume at the swing point relative to the 20-period volume SMA. This helps traders prioritize pools where significant participation occurred.
4. Fair Value Gap (FVG) Analysis
A bullish FVG forms when the current bar's low is above the high from two bars ago, creating a gap in price delivery. A bearish FVG is the inverse. The indicator filters FVGs by a minimum size (default 0.3x ATR) to avoid plotting insignificant gaps.
Each FVG is drawn as a colored box. When Consequent Encroachment is enabled, a dashed line is drawn at the 50% level of the gap, which institutional traders often use as a precise entry point. FVGs are tracked for mitigation: when price fills the gap, the box style changes to indicate it has been mitigated. FVGs older than the configurable max age (default 50 bars) are automatically removed.
5. Premium/Discount Zones
Using a configurable lookback period (default 50 bars), the indicator calculates the highest high and lowest low, then divides the range into zones. The top 20% is the premium zone (where sellers have an edge), the bottom 20% is the discount zone (where buyers have an edge), and the 50% level is the equilibrium. These zones are drawn as semi-transparent boxes with an equilibrium line.
Visual Elements
- Swing Point Labels: HH, HL, LH, LL labels at each confirmed pivot
- Structure Lines: Horizontal lines at BOS/CHoCH levels with configurable styles
- Order Block Boxes: Semi-transparent boxes with equilibrium midlines
- Liquidity Pool Boxes: Thin boxes at swing levels with SWEEP/TRAP labels
- FVG Zones: Colored boxes with optional CE (50%) lines
- Premium/Discount Zones: Background shading for range context
- Candle Coloring: Optional trend-based candle coloring
- Dashboard: Real-time metrics including trend direction, structure counts, and sweep/trap counts
Input Parameters
Structure Detection:
- Pivot Sensitivity (2-20, default 5): Lower values detect more pivots, higher values only detect stronger swings
- Show BOS / Show CHoCH: Toggle each structure type independently
- Structure Line Style: Solid, Dashed, or Dotted
Order Block Detection:
- Order Block Strength (1-10, default 3): Minimum candles for valid OB
- Track OB Mitigation: Automatically remove mitigated OBs
- Min OB Size (ATR): Minimum order block size filter
Liquidity Detection:
- Liquidity Sensitivity (1-10, default 3)
- Sweep Threshold (ATR): How far price must pierce a level to count as a sweep
- Volume-Weighted Liquidity: Weight pools by volume participation
Fair Value Gaps:
- FVG Max Age (bars): Auto-remove old FVGs (default 50)
- Track FVG Mitigation: Monitor and update filled gaps
- Min FVG Size (ATR): Filter small gaps
- Show Consequent Encroachment: Draw 50% midline
Premium/Discount Zones:
- Zone Lookback (20-200, default 50)
- Show Equilibrium Line
How to Use This Indicator
Step 1: Identify the current market structure by observing BOS/CHoCH labels. A series of bullish BOS confirms an uptrend; a bearish CHoCH warns of a potential reversal.
Step 2: Look for unmitigated order blocks in the direction of the trend. In an uptrend, focus on bullish OBs below current price as potential support zones.
Step 3: Check if any FVGs overlap with order blocks. This confluence of an institutional entry zone (OB) with an imbalance in price delivery (FVG) creates a high-probability area.
Step 4: Confirm the zone is in the discount area (for longs) or premium area (for shorts) using the premium/discount zones.
Step 5: Monitor liquidity pools for sweeps. A sweep of a liquidity pool followed by a reversal into a confluence zone is a classic institutional entry pattern.
Step 6: Use the dashboard to monitor overall market conditions and structure counts.
Example showing a confluence setup: FVG overlapping with an order block in the discount zone, with a nearby liquidity sweep
Indicator Limitations
- Pivot detection has an inherent delay equal to the pivot lookback period. Structure labels appear after confirmation, not in real time.
- Order blocks and FVGs are based on historical price patterns and do not predict future price movement.
- Volume-weighted features work best on instruments with reliable volume data. Low-volume instruments may produce less meaningful liquidity weights.
- The indicator draws many visual elements simultaneously. On lower timeframes with high bar counts, consider reducing the Max Structure Elements setting to maintain chart performance.
- Premium/discount zones are relative to the lookback period. Changing the lookback significantly alters the zones.
- Smart Money Concepts are interpretive frameworks, not guaranteed predictors. Always use proper risk management.
Originality Statement
This indicator is original in its unified integration approach. While individual SMC components (BOS, CHoCH, order blocks, FVGs, liquidity pools) exist in separate scripts, this indicator is justified because:
- It combines five distinct SMC methodologies into a single, object-oriented system using Pine Script v6 user-defined types
- Volume-weighted liquidity pool detection adds a quantitative dimension to traditional swing-based liquidity mapping
- Smart Money Trap detection (high-volume sweeps) provides a layer of institutional activity analysis not found in standard liquidity tools
- FVG lifecycle tracking with consequent encroachment gives traders precise institutional entry levels
- The premium/discount zone overlay provides immediate context for whether a setup is in a favorable or unfavorable area of the range
- All components share state and interact: structure breaks trigger order block creation, liquidity pools are validated against volume data, and FVGs are checked against premium/discount positioning
Disclaimer
This indicator is provided for educational and informational purposes only. It is not financial advice or a recommendation to buy or sell any financial instrument. Trading involves substantial risk of loss and is not suitable for all investors. Smart Money Concepts are analytical frameworks that help interpret market behavior, but they do not guarantee profitable trades. Past patterns do not guarantee future results. Always use proper risk management, including stop losses and position sizing appropriate for your account. The author is not responsible for any losses incurred from using this indicator.
-Made with passion by officialjackofalltrades
Script open-source
Dans l'esprit TradingView, le créateur de ce script l'a rendu open source afin que les traders puissent examiner et vérifier ses fonctionnalités. Bravo à l'auteur! Bien que vous puissiez l'utiliser gratuitement, n'oubliez pas que la republication du code est soumise à nos Règles.

The Institutional Grade Trading Ecosystem, Built to win trades 📈
Get Access 👇
jackofalltrades.vip 🌐
t.me/jackofalltradesvip 🃏
Get Access 👇
jackofalltrades.vip 🌐
t.me/jackofalltradesvip 🃏
Clause de non-responsabilité
Les informations et publications ne sont pas destinées à être, et ne constituent pas, des conseils ou recommandations financiers, d'investissement, de trading ou autres fournis ou approuvés par TradingView. Pour en savoir plus, consultez les Conditions d'utilisation.
Script open-source
Dans l'esprit TradingView, le créateur de ce script l'a rendu open source afin que les traders puissent examiner et vérifier ses fonctionnalités. Bravo à l'auteur! Bien que vous puissiez l'utiliser gratuitement, n'oubliez pas que la republication du code est soumise à nos Règles.
The Institutional Grade Trading Ecosystem, Built to win trades 📈
Get Access 👇
jackofalltrades.vip 🌐
t.me/jackofalltradesvip 🃏
Get Access 👇
jackofalltrades.vip 🌐
t.me/jackofalltradesvip 🃏
Clause de non-responsabilité
Les informations et publications ne sont pas destinées à être, et ne constituent pas, des conseils ou recommandations financiers, d'investissement, de trading ou autres fournis ou approuvés par TradingView. Pour en savoir plus, consultez les Conditions d'utilisation.