OPEN-SOURCE SCRIPT
Coldbore Labs - Time-of-Day Volatility
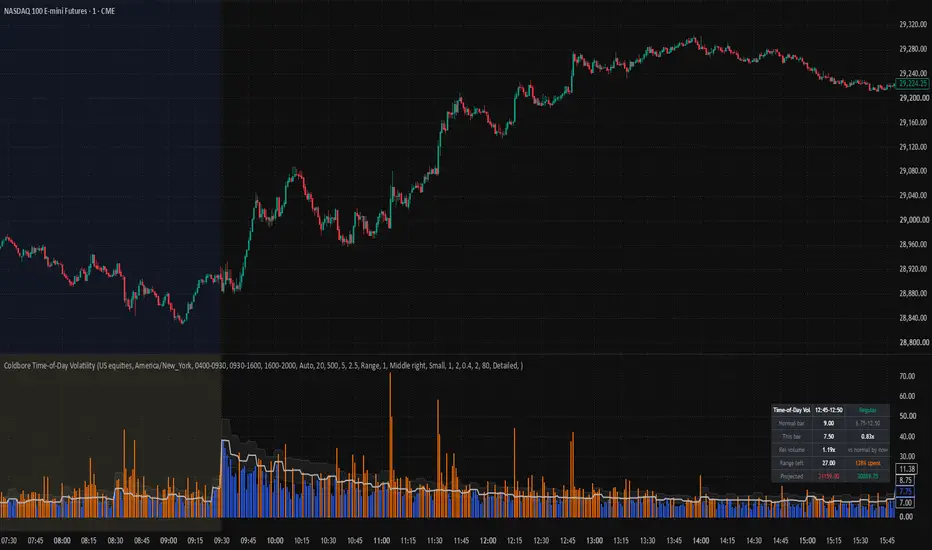
Time-of-Day Volatility answers a question a standard ATR cannot: is this bar actually unusual, or is it simply normal for this hour? It builds a profile of what range, participation and direction look like at each specific time of day on this instrument, then shows you live how the current moment compares.
THE PROBLEM
On an actively traded instrument, a 2-minute bar with a 40-cent range is a non-event at 09:34 and an outlier at 12:40. Every standard volatility measure, ATR included, blends dead overnight tape into the same lookback as the opening drive. The result is an ATR that is understated at the open, so stops sit too tight exactly when they need to be widest, and overstated at midday, so targets sit too far exactly when the tape cannot reach them. This script corrects for that by conditioning every measurement on the clock.
WHAT IT MEASURES
HOW IT WORKS
1. Time buckets. Every bar is assigned to a bucket by its clock time. Bucket width auto-sizes from the chart timeframe: 5 minutes on charts up to 5 minutes, 15 up to 15, 30 up to 30, 60 above that. A bucket narrower than the chart timeframe cannot be populated, so it is clamped.
2. Rolling pools. Each bucket stores the range, volume, cumulative session volume and direction of every confirmed bar that has fallen into it, keeping roughly the most recent 20 days and overwriting the oldest.
3. Medians, not means. Statistics are read as medians. One halt, one gap or one unusual print can drag a mean out of line for weeks, and range distributions are heavily right-skewed. The 25th and 75th percentiles are read from the same pool to form the normal-range band. The expectation is read before the current bar is written into its pool, so no bar is ever measured against a number it helped create.
4. The comparison. The current bar's range divided by the expected range is the ratio the script is built around: 1.0 is perfectly normal for this time of day, 2.0 is double, 0.4 is unusually quiet. The band tells you whether that number is genuinely remarkable — a bar at 1.4x is ordinary if the 75th percentile sits at 1.6x.
5. Relative volume. Because each bucket also stores the running session volume at that point, today's cumulative volume can be compared against what is normal by the same moment in the session, rather than against a rolling average that ignores the time of day entirely.
6. Range still to come. This is not the median day range minus what has been spent, which becomes nonsense late in the session. At every session close the script records how much additional range each bucket actually saw between that point and the bell, then reports the median of those observations. The figure therefore falls naturally toward zero as the close approaches.
7. The session-open projection. At the open the script combines the median session range with the median position of the open inside that range to project a likely high and low for the day. It is a statistical frame for the session, not a forecast.
8. Sample hygiene. Shortened sessions around holidays distort both the afternoon buckets and the daily statistics, so sessions with materially fewer bars than normal are excluded from the day-level numbers by default. Optionally, days whose range far exceeds the running median can also be excluded so a single event day does not skew the budget for weeks.
HOW TO USE IT
This is a context tool. It does not generate entries or exits and says nothing about direction on its own.
WHAT MAKES IT DIFFERENT
Time-conditioned relative volume is well-established, and this script implements a solid version of it. The distinguishing work is on the volatility side and in what the two together enable.
INPUTS
Market and sessions: market preset (US equities, futures, forex, 24-hour crypto or custom); timezone, including an option to follow the exchange; custom session windows; session tinting and colours.
Profile: bucket width (Auto or fixed); days in the sample (default 20); separate profile per weekday (default off); naive baseline period; minimum sample to trust a bucket; exclude shortened sessions (default on); exclude outlier days with a multiplier (default off).
Display: what to show (Range, Volume, Ratio to expected, Relative volume); columns, expected line, normal-range band, expansion threshold line; ratio smoothing; colours for above expectation, within expectation, the expected line and insufficient sample.
Exports: draw the session-corrected ATR; draw the volatility multiplier.
Dashboard: show, position, size, blank rows above the card; optional rows for the session projection, sample size, per-bar participation, volatility multiplier, day range detail, bucket rank and directional drift.
Alerts: expansion and contraction thresholds; relative volume threshold; range budget warning level; individual alert toggles; message format and custom tag.
VISUALS
ALERTS
Create an alert on the indicator and select "Any alert() function call" to receive messages with live figures. Message format can be Detailed, Plain text or JSON for webhooks, with an optional custom tag. Available events: range expansion, range contraction, unusual relative volume, range budget warning, range budget spent, and the session-open briefing carrying the expected range and projected high and low. Matching fixed alert conditions are also available. All bar-level conditions are evaluated on bar close.
LIMITATIONS AND GOTCHAS
This script is intended for analysis and education and is not financial advice.
THE PROBLEM
On an actively traded instrument, a 2-minute bar with a 40-cent range is a non-event at 09:34 and an outlier at 12:40. Every standard volatility measure, ATR included, blends dead overnight tape into the same lookback as the opening drive. The result is an ATR that is understated at the open, so stops sit too tight exactly when they need to be widest, and overstated at midday, so targets sit too far exactly when the tape cannot reach them. This script corrects for that by conditioning every measurement on the clock.
WHAT IT MEASURES
- Expected bar range for the current time slot, with a percentile band showing the normal spread of outcomes rather than a single number.
- Cumulative relative volume — total session volume so far against what this instrument normally trades by this point in the day.
- Range still to come between now and the session close.
- A session-open projection of the day's likely high and low.
- Directional lean for the current time slot.
HOW IT WORKS
1. Time buckets. Every bar is assigned to a bucket by its clock time. Bucket width auto-sizes from the chart timeframe: 5 minutes on charts up to 5 minutes, 15 up to 15, 30 up to 30, 60 above that. A bucket narrower than the chart timeframe cannot be populated, so it is clamped.
2. Rolling pools. Each bucket stores the range, volume, cumulative session volume and direction of every confirmed bar that has fallen into it, keeping roughly the most recent 20 days and overwriting the oldest.
3. Medians, not means. Statistics are read as medians. One halt, one gap or one unusual print can drag a mean out of line for weeks, and range distributions are heavily right-skewed. The 25th and 75th percentiles are read from the same pool to form the normal-range band. The expectation is read before the current bar is written into its pool, so no bar is ever measured against a number it helped create.
4. The comparison. The current bar's range divided by the expected range is the ratio the script is built around: 1.0 is perfectly normal for this time of day, 2.0 is double, 0.4 is unusually quiet. The band tells you whether that number is genuinely remarkable — a bar at 1.4x is ordinary if the 75th percentile sits at 1.6x.
5. Relative volume. Because each bucket also stores the running session volume at that point, today's cumulative volume can be compared against what is normal by the same moment in the session, rather than against a rolling average that ignores the time of day entirely.
6. Range still to come. This is not the median day range minus what has been spent, which becomes nonsense late in the session. At every session close the script records how much additional range each bucket actually saw between that point and the bell, then reports the median of those observations. The figure therefore falls naturally toward zero as the close approaches.
7. The session-open projection. At the open the script combines the median session range with the median position of the open inside that range to project a likely high and low for the day. It is a statistical frame for the session, not a forecast.
8. Sample hygiene. Shortened sessions around holidays distort both the afternoon buckets and the daily statistics, so sessions with materially fewer bars than normal are excluded from the day-level numbers by default. Optionally, days whose range far exceeds the running median can also be excluded so a single event day does not skew the budget for weeks.
HOW TO USE IT
- Size stops and targets by the clock. Read the Normal bar row and scale from it. If a normal bar is 1.20 at 09:35 and 0.30 at 12:30, a stop sized for one is wrong for the other.
- Treat expansion in quiet hours as information. A bar breaching its expected range at 12:45 means participation arrived when there normally is none. A large candle at 09:32 that stays within expectation is just the open behaving like the open.
- Check whether participation backs the move. Range expanding while relative volume sits below 1.0 is a different proposition from both expanding together.
- Let the range budget choose your approach. Early in the session with little of a normal range spent, there is room for continuation ideas to work. Well past a full normal day's range, continuation is working against the instrument's own distribution. Treat it as context for which approach fits, not as a signal.
- Watch compression in normally active slots. Sustained readings well under expectation during a time that is usually busy indicate contraction. It says nothing about direction.
- Use the open briefing to frame the day. The expected range and projected high and low give you a starting picture before the session develops.
- Check the sample before trusting anything. On a freshly loaded chart, or after changing timeframe, buckets need history before their numbers mean anything.
This is a context tool. It does not generate entries or exits and says nothing about direction on its own.
WHAT MAKES IT DIFFERENT
Time-conditioned relative volume is well-established, and this script implements a solid version of it. The distinguishing work is on the volatility side and in what the two together enable.
- Volatility conditioned on the clock, with a distribution. Most volatility tools give one blended number. This gives an expected range for the specific minute of the session plus the percentile band around it, so "unusual" is measured against the real spread of outcomes rather than a single average.
- A session-corrected ATR you can export. The expected bar range is published as a plot that any script with a source input can select, so volatility scaling elsewhere in your setup can be corrected for time of day instead of inheriting the blended error.
- A multiplier that quantifies the error. The time-of-day expectation divided by a deliberately naive all-session baseline tells you exactly how far a conventional ATR is off at this moment.
- Forward-looking range projection. Because the remaining-range statistic is built retroactively from what actually happened after each bucket on past sessions, it is a genuine estimate of what is left rather than arithmetic on a daily average.
- Median-based throughout, with sample transparency. Percentiles and medians rather than means, thin buckets greyed out and excluded from alerts, and holiday sessions filtered from the day statistics.
- Optional weekday profiles. Separate histories per day of the week, with the sample cost stated plainly rather than hidden.
INPUTS
Market and sessions: market preset (US equities, futures, forex, 24-hour crypto or custom); timezone, including an option to follow the exchange; custom session windows; session tinting and colours.
Profile: bucket width (Auto or fixed); days in the sample (default 20); separate profile per weekday (default off); naive baseline period; minimum sample to trust a bucket; exclude shortened sessions (default on); exclude outlier days with a multiplier (default off).
Display: what to show (Range, Volume, Ratio to expected, Relative volume); columns, expected line, normal-range band, expansion threshold line; ratio smoothing; colours for above expectation, within expectation, the expected line and insufficient sample.
Exports: draw the session-corrected ATR; draw the volatility multiplier.
Dashboard: show, position, size, blank rows above the card; optional rows for the session projection, sample size, per-bar participation, volatility multiplier, day range detail, bucket rank and directional drift.
Alerts: expansion and contraction thresholds; relative volume threshold; range budget warning level; individual alert toggles; message format and custom tag.
VISUALS
- Columns: the current measure, coloured above or within expectation. Grey means the bucket has insufficient history.
- Line: the expected value for this time of day.
- Shaded band: the 25th to 75th percentile of this bucket's history.
- Background tint: which session each bar belongs to, so the daily shape is visible at a glance.
- Dashboard: five core rows (time bucket, normal bar with its band, this bar and its ratio, relative volume, range left with percentage spent), plus the session projection and six optional diagnostic rows.
ALERTS
Create an alert on the indicator and select "Any alert() function call" to receive messages with live figures. Message format can be Detailed, Plain text or JSON for webhooks, with an optional custom tag. Available events: range expansion, range contraction, unusual relative volume, range budget warning, range budget spent, and the session-open briefing carrying the expected range and projected high and low. Matching fixed alert conditions are also available. All bar-level conditions are evaluated on bar close.
LIMITATIONS AND GOTCHAS
- It needs history before it means anything. Buckets start empty and fill as the chart loads. The range-left figure requires at least one fully completed session, because it is written retroactively at the close.
- Sample is counted in bar observations, not days. On a chart where several bars fall in each bucket, the count rises faster than the number of days behind it.
- Weekday profiles divide the sample by five. Pool depth is also capped tighter in that mode to stay within Pine's memory limits. Raise the history setting and watch the sample readout.
- Relative volume needs real volume. Symbols without reliable volume data, such as some indices or tick-volume forex feeds, will produce a meaningless or empty reading on that row.
- The projection is a frame, not a forecast. It is built from median statistics and will be wrong on trend days and event days, which is precisely when it matters most that you treat it as context.
- During a forming bar the ratio rises as the bar develops, since range can only grow. Alerts are gated to bar close for this reason; the dashboard is live.
- Directional drift is easy to over-read. On a small sample it is noise. It is descriptive, not predictive.
- Holiday filtering is heuristic. Shortened sessions are detected by bar count relative to normal, which works for scheduled half days but cannot know why a session was short.
- Session and timezone settings matter. If the windows do not match the instrument, every bucket is mislabelled. Check the preset before relying on the output.
- Exports are data-window plots so they never distort the pane scale. Enable the draw options if you want to see them plotted.
- Intraday charts only. Use standard candles or bars; Heikin Ashi, Renko and other non-standard types distort range and volume.
- Past behaviour at a given time of day does not guarantee future behaviour.
This script is intended for analysis and education and is not financial advice.
Script open-source
Dans l'esprit TradingView, le créateur de ce script l'a rendu open source afin que les traders puissent examiner et vérifier ses fonctionnalités. Bravo à l'auteur! Bien que vous puissiez l'utiliser gratuitement, n'oubliez pas que la republication du code est soumise à nos Règles.

Clause de non-responsabilité
Les informations et publications ne sont pas destinées à être, et ne constituent pas, des conseils ou recommandations financiers, d'investissement, de trading ou autres fournis ou approuvés par TradingView. Pour en savoir plus, consultez les Conditions d'utilisation.
Script open-source
Dans l'esprit TradingView, le créateur de ce script l'a rendu open source afin que les traders puissent examiner et vérifier ses fonctionnalités. Bravo à l'auteur! Bien que vous puissiez l'utiliser gratuitement, n'oubliez pas que la republication du code est soumise à nos Règles.
Clause de non-responsabilité
Les informations et publications ne sont pas destinées à être, et ne constituent pas, des conseils ou recommandations financiers, d'investissement, de trading ou autres fournis ou approuvés par TradingView. Pour en savoir plus, consultez les Conditions d'utilisation.