Mis à jour
Behavioural Pressure Map
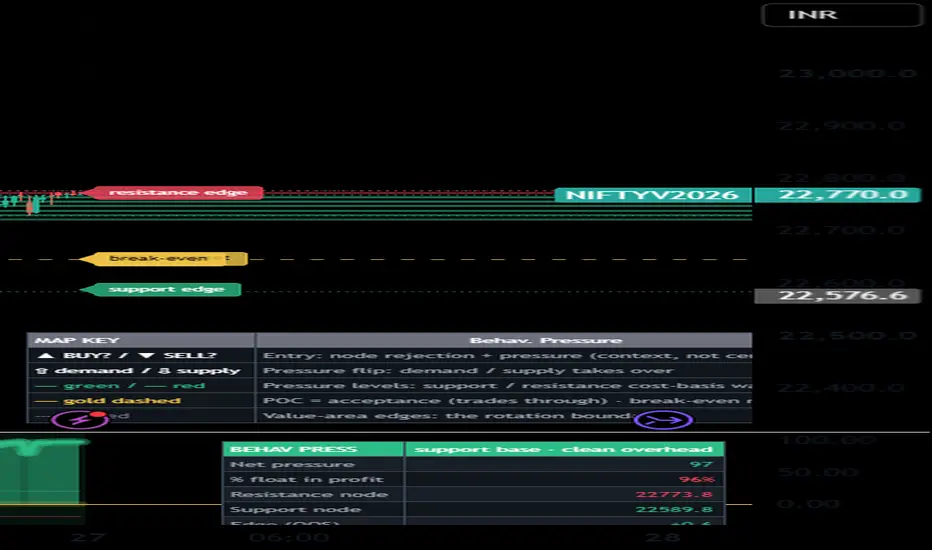
Behavioural Pressure Map is a map of WHERE the market's holders sit and what behavioural finance says they will do there. Every past bar is treated as a cohort that bought around its price on its volume; each cohort's unrealised profit/loss is run through the Kahneman–Tversky prospect-theory value function, and the disposition effect (people sell winners and hold losers) turns that into real supply and demand:
Trapped LOSERS above price wait to get back to break-even — behavioural RESISTANCE, made sticky by loss aversion (λ).
In-profit cohorts below price mark high-volume DEMAND nodes the market defends — SUPPORT.
The recency-weighted average cost is a reference-point MAGNET price gravitates toward.
The pane plots NET behavioural pressure (−100 = heavy overhead supply … +100 = clean, in-profit float). The price chart is annotated with the strongest support/resistance cost-basis nodes and the magnet. Triangles mark a node rejection that occurs with supportive (at support) or overhead (at resistance) pressure. The "% of float in profit" is a sentiment gauge — very high can mean euphoria/distribution risk, very low can mean capitulation.
How to use. Read the pane for pressure (green/above 0 = supportive, in-profit float; red/below 0 = overhead supply). On price: red lines are behavioural resistance (trapped longs), green lines are support (defended profit nodes), the yellow dashed line is the magnet. The Edge row (in-sample and out-of-sample) is the honest check — it tells you whether node rejections have actually paid on THIS symbol and timeframe. This is positioning context, never a standalone buy/sell trigger.
Key inputs. Cohort lookback and recency half-life (how much of the float, and how fast old holders are forgotten); prospect-theory α/β curvature and loss-aversion λ; bin count and node strength threshold; pressure threshold; the calibration horizon and move threshold; an optional external-regime link. Defaults suit liquid index/futures behaviour — widen the lookback or shorten the half-life for slower or faster instruments. Needs volume; works on any symbol/timeframe.
Why it's more than a volume profile. A volume profile shows WHERE volume traded; this adds WHY that volume matters, by weighting each price level by the unrealised P&L of the people who own it and by how loss aversion and the disposition effect make them act. A heavy TRAPPED-LONG node above price is stronger resistance than an equal-size node of comfortable winners — prospect theory, not raw volume, sizes the pressure. Every part serves one question — where is positioning pressure, and which way will it push: the cohort cost-basis distribution (ownership), the prospect-theory value function v(g) = g^α for gains and −λ·(−g)^β for losses (holder pain), the disposition effect (defended demand vs sticky supply), the reference-point magnet, and a forward-calibration harness that checks whether it pays.
Honesty / non-repaint. Cost basis is APPROXIMATED by each bar's HLC3 and volume — it is not real holder data, and the value function is a model of behaviour, not a law. The pressure reading and cost-basis nodes are DESCRIPTIVE positioning context. The calibration row is the honest check: it scores each node-rejection signal by whether price moved ≥ (move threshold × ATR) the signalled way within the horizon, compares it to the unconditional base rate of a same-size move, and reports in-sample and out-of-sample hit rates with a multiple-testing-deflated Wilson lower bound (the ★ is earned only when the out-of-sample lower bound clears the base rate with ≥ 10 events). The out-of-sample edge is the trustworthy number; a positive one is necessary, not sufficient. Cohorts are built from closed bars, the calibration resolves only on confirmed bars, and by default signals, their alerts and their markers settle on the closed bar — so what you see matches what the harness measures. No request.security, no lookahead. The calibration is in-sample/OOS on the loaded history with no execution costs — not a backtest and not a promise about the future.
Concept credit: prospect theory & the value function — Kahneman & Tversky (1979); disposition effect — Shefrin & Statman (1985), Odean (1998); reference-point / cost-basis dynamics — Grinblatt & Han (2005); sample-uniqueness & out-of-sample evaluation — López de Prado (2018). Original implementation, not affiliated with any third party.
Research and educational tool only. NOT financial advice and no guarantee of profitability or accuracy. Trading carries risk of loss. Test out-of-sample and make your own decisions.
Trapped LOSERS above price wait to get back to break-even — behavioural RESISTANCE, made sticky by loss aversion (λ).
In-profit cohorts below price mark high-volume DEMAND nodes the market defends — SUPPORT.
The recency-weighted average cost is a reference-point MAGNET price gravitates toward.
The pane plots NET behavioural pressure (−100 = heavy overhead supply … +100 = clean, in-profit float). The price chart is annotated with the strongest support/resistance cost-basis nodes and the magnet. Triangles mark a node rejection that occurs with supportive (at support) or overhead (at resistance) pressure. The "% of float in profit" is a sentiment gauge — very high can mean euphoria/distribution risk, very low can mean capitulation.
How to use. Read the pane for pressure (green/above 0 = supportive, in-profit float; red/below 0 = overhead supply). On price: red lines are behavioural resistance (trapped longs), green lines are support (defended profit nodes), the yellow dashed line is the magnet. The Edge row (in-sample and out-of-sample) is the honest check — it tells you whether node rejections have actually paid on THIS symbol and timeframe. This is positioning context, never a standalone buy/sell trigger.
Key inputs. Cohort lookback and recency half-life (how much of the float, and how fast old holders are forgotten); prospect-theory α/β curvature and loss-aversion λ; bin count and node strength threshold; pressure threshold; the calibration horizon and move threshold; an optional external-regime link. Defaults suit liquid index/futures behaviour — widen the lookback or shorten the half-life for slower or faster instruments. Needs volume; works on any symbol/timeframe.
Why it's more than a volume profile. A volume profile shows WHERE volume traded; this adds WHY that volume matters, by weighting each price level by the unrealised P&L of the people who own it and by how loss aversion and the disposition effect make them act. A heavy TRAPPED-LONG node above price is stronger resistance than an equal-size node of comfortable winners — prospect theory, not raw volume, sizes the pressure. Every part serves one question — where is positioning pressure, and which way will it push: the cohort cost-basis distribution (ownership), the prospect-theory value function v(g) = g^α for gains and −λ·(−g)^β for losses (holder pain), the disposition effect (defended demand vs sticky supply), the reference-point magnet, and a forward-calibration harness that checks whether it pays.
Honesty / non-repaint. Cost basis is APPROXIMATED by each bar's HLC3 and volume — it is not real holder data, and the value function is a model of behaviour, not a law. The pressure reading and cost-basis nodes are DESCRIPTIVE positioning context. The calibration row is the honest check: it scores each node-rejection signal by whether price moved ≥ (move threshold × ATR) the signalled way within the horizon, compares it to the unconditional base rate of a same-size move, and reports in-sample and out-of-sample hit rates with a multiple-testing-deflated Wilson lower bound (the ★ is earned only when the out-of-sample lower bound clears the base rate with ≥ 10 events). The out-of-sample edge is the trustworthy number; a positive one is necessary, not sufficient. Cohorts are built from closed bars, the calibration resolves only on confirmed bars, and by default signals, their alerts and their markers settle on the closed bar — so what you see matches what the harness measures. No request.security, no lookahead. The calibration is in-sample/OOS on the loaded history with no execution costs — not a backtest and not a promise about the future.
Concept credit: prospect theory & the value function — Kahneman & Tversky (1979); disposition effect — Shefrin & Statman (1985), Odean (1998); reference-point / cost-basis dynamics — Grinblatt & Han (2005); sample-uniqueness & out-of-sample evaluation — López de Prado (2018). Original implementation, not affiliated with any third party.
Research and educational tool only. NOT financial advice and no guarantee of profitability or accuracy. Trading carries risk of loss. Test out-of-sample and make your own decisions.
Notes de version
UPDATE — Accuracy + measured optimisation + a readable, decluttered map. Cohort size is now spread across each bar's real price range (range-intersection binning) and the cost-basis distribution is smoothed, so the support/resistance nodes sit where holders actually accumulated and stay stable. A contribution lab forward-tested every lever: order-flow confluence earned its place (required on 3m+); the prospect-theory weighting measured as an honest behavioural LABEL, not an edge over plain volume (now togglable); and the HEAVIEST node measured anti-predictive for rejection — it is the accepted price, a magnet price trades through — so signals now fire at the value-area EDGES (rotation boundaries), not the POC, which is drawn as the acceptance magnet. The overlay is redrawn as a MAP with three labelled mark types — ENTRY (BUY?/SELL?), PRESSURE FLIP (⇧demand/⇩supply) and named LEVELS — plus a key. And it is decluttered: each approach fires ONCE, a 0–3 conviction score drives a Minimum signal strength filter (default "Strong only"), and the entry triangles are kept small/tiny (small for the strongest tag, tiny for the rest) so the overlay stays light. Honest framing throughout: this is a positioning map with a measured out-of-sample self-test, not a signal engine; the net-pressure line is context, never a directional lead. Non-repainting, in-sample/OOS, research/education only — not advice.
Clause de non-responsabilité
Les informations et publications ne sont pas destinées à être, et ne constituent pas, des conseils ou recommandations financiers, d'investissement, de trading ou autres fournis ou approuvés par TradingView. Pour en savoir plus, consultez les Conditions d'utilisation.
Clause de non-responsabilité
Les informations et publications ne sont pas destinées à être, et ne constituent pas, des conseils ou recommandations financiers, d'investissement, de trading ou autres fournis ou approuvés par TradingView. Pour en savoir plus, consultez les Conditions d'utilisation.