OPEN-SOURCE SCRIPT
Edo EMA Core Cross
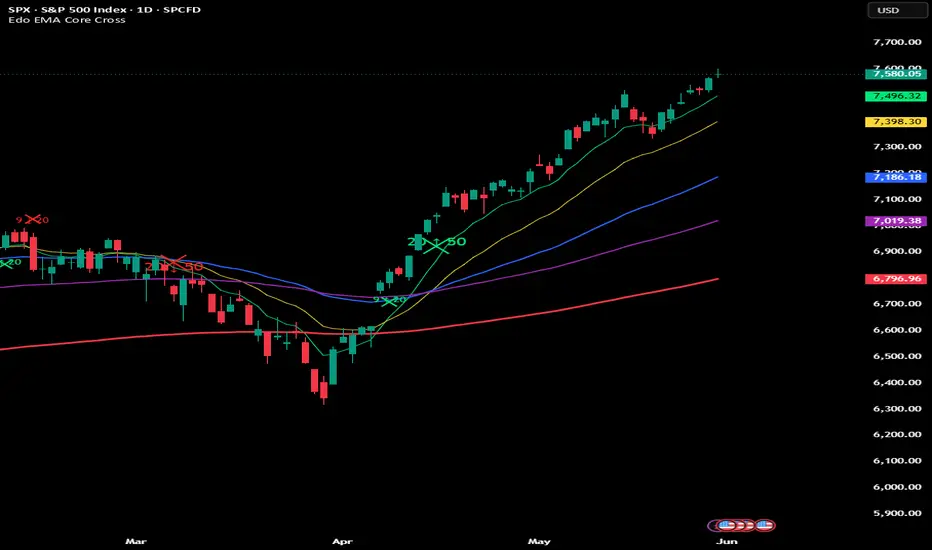
Edo EMA Core Cross — Five-EMA Structure with a Three-Tier Cross Hierarchy and Weight-Scaled Markers (Momentum, Structure and Golden/Death Cross)
The exponential moving average (EMA) is one of the most basic elements of technical analysis: a dynamic equilibrium level that weights recent price more heavily. When a fast EMA crosses a slow one, that cross marks a change in the rhythm of the market, and it is one of the oldest and most reliable readings there is. The problem is not the EMA itself, but the handling: plotting five EMAs on the chart, watching by hand which pair has just crossed and remembering how much structural weight each cross carries is noisy, slow and error-prone, especially when what matters is not that there is a cross, but what kind of cross it is.
Edo EMA Core Cross was built to solve that. It does not reinvent the EMA: it organizes five key EMAs into a three-tier cross hierarchy and marks each cross with a visual weight proportional to its structural importance, so the trader tells apart at a glance short-term noise, operating rotation and a larger structural change.
This indicator does not predict price nor generate automatic signals: it visualizes transitions that are already happening so the trader can align with them.
WHAT THE INDICATOR DOES
The indicator plots five EMAs and monitors three cross pairs, assigning each pair a distinct hierarchical level. The five EMAs —9, 20, 50, 100 and 200— represent five speeds of the market, from immediate momentum, read by the 9, to the dominant structural bias, read by the 200. Conceptually, each EMA acts as a dynamic equilibrium level: when a faster EMA crosses above a slower one it signals growing bullish pressure, and when it crosses below, growing bearish pressure. What Edo EMA Core Cross adds is classifying those crosses into three hierarchies according to which averages are involved, because not all crosses carry the same weight.
THE FIVE EMAs
The five averages form a hierarchy of speeds. The EMA 9 reads immediate momentum; the EMA 20, the short term; the EMA 50, intermediate structure; the EMA 100, background structure; and the EMA 200, the dominant structural bias. Plotted together, they let you read the market as a hierarchical system where short-term moves develop inside larger structural layers. The thickness of each line grows with its weight —the 200 is the thickest— to reinforce the hierarchy visually.
THE HIERARCHICAL CROSS SYSTEM
It is the core of the indicator. Each cross pair is marked with a visual weight proportional to its structural relevance. The cross of the EMA 9 with the EMA 20 corresponds to momentum: fast changes and internal transitions within the prevailing structure, flagged with a small marker. The cross of the EMA 20 with the EMA 50 corresponds to structure: deeper operating rotations and possible mid-structure transitions, with a medium marker. The cross of the EMA 50 with the EMA 200 is the Golden Cross or Death Cross, the heaviest event, the classic structural cross that marks a long-term bias change, with a large marker set apart by its macro importance. This gradation is what turns a pile of EMAs into a structured reading: the size of the marker tells you, without measuring anything, whether what just happened is short-term noise, an operating rotation or a larger structural turn.
MARKERS AND LABELS
Each cross is flagged with an X-marker —below the candle if bullish, above if bearish— and with a readable label that identifies the pair and the direction, for example "9 ↑ 20" for a bullish cross of the 9 over the 20 or "50 ↓ 200" for a Death Cross. Each cross hierarchy can be toggled independently, so the trader can keep only the levels of interest, for example hiding the 9/20 noise and watching only the Golden and Death Cross.
ALERTS
Edo EMA Core Cross includes six alert conditions configurable from the standard TradingView alerts dialog, one bullish and one bearish for each of the three cross hierarchies. In the momentum hierarchy, the bullish alert fires when the 9 crosses above the 20 and the bearish one when it crosses below. In the structure hierarchy, when the 20 crosses above or below the 50. And in the major hierarchy, the Golden Cross when the 50 crosses above the 200 and the Death Cross when it crosses below. The alerts are independent of the visual toggles: they fire even if the corresponding hierarchy is hidden on the chart, so the trader can keep the chart clean and still receive the warning for the level of interest.
HOW TO READ IT
It is worth reading the hierarchy first: before reacting to a cross, look at its size, because a small 9/20 marker is momentum and a large 50/200 marker is structure, and the kind of cross matters more than the cross itself. Then align the speeds by checking the order of the EMAs: when they are stacked from fast to slow in bullish order, the 9 over the 20 over the 50 over the 200, the structure is clean, and when they interleave, the market is in transition. The Golden or Death Cross is contextualized: a 50/200 cross confirms a long-term bias change, but it is not an entry trigger, and it gains value when it coincides with structure and with relevant levels on the chart. Overall, the crosses are used as confirmation and not as anticipation: the indicator visualizes transitions that are already happening, and it serves to align with the structural change, not to front-run it blindly.
ORIGINALITY AND MASHUP JUSTIFICATION
EMAs are a public-domain component and this indicator does not pretend otherwise: it neither renames them nor presents them as something proprietary. The value is not in the averages, but in how they are coordinated. Plotting five EMAs by hand leaves the trader the task of identifying which pair crosses, remembering how much structural weight each pair carries and telling a momentum cross apart from a structural change, a manual, slow and error-prone job in real time. Edo EMA Core Cross solves that with one concrete design decision: ranking the crosses into three tiers and scaling the visual weight of each marker to its structural importance, so the three hierarchies —momentum with the 9/20, structure with the 20/50 and Golden or Death Cross with the 50/200— are read simultaneously and told apart at a glance. That visual coordination of the three hierarchies on a single clean overlay, and not the EMAs separately, is what the indicator contributes.
CONFIGURATION
Show EMA 9 / 20 Cross toggles the momentum hierarchy; Show EMA 20 / 50 Cross, the structure hierarchy; and Show EMA 50 / 200 Cross, the Golden and Death Cross. The colors and thicknesses of the EMAs are customized from the TradingView Style tab.
OPEN SOURCE
Edo EMA Core Cross is published as an open source and free indicator. The full Pine Script is publicly available on TradingView for study, adaptation and integration into any workflow.
This indicator is a technical analysis tool intended exclusively for educational and informational purposes. It does not generate automatic buy or sell signals and should not be considered financial advice. Trading in financial markets carries a significant risk of capital loss. Past results do not guarantee future results. Always use proper risk management.
The exponential moving average (EMA) is one of the most basic elements of technical analysis: a dynamic equilibrium level that weights recent price more heavily. When a fast EMA crosses a slow one, that cross marks a change in the rhythm of the market, and it is one of the oldest and most reliable readings there is. The problem is not the EMA itself, but the handling: plotting five EMAs on the chart, watching by hand which pair has just crossed and remembering how much structural weight each cross carries is noisy, slow and error-prone, especially when what matters is not that there is a cross, but what kind of cross it is.
Edo EMA Core Cross was built to solve that. It does not reinvent the EMA: it organizes five key EMAs into a three-tier cross hierarchy and marks each cross with a visual weight proportional to its structural importance, so the trader tells apart at a glance short-term noise, operating rotation and a larger structural change.
This indicator does not predict price nor generate automatic signals: it visualizes transitions that are already happening so the trader can align with them.
WHAT THE INDICATOR DOES
The indicator plots five EMAs and monitors three cross pairs, assigning each pair a distinct hierarchical level. The five EMAs —9, 20, 50, 100 and 200— represent five speeds of the market, from immediate momentum, read by the 9, to the dominant structural bias, read by the 200. Conceptually, each EMA acts as a dynamic equilibrium level: when a faster EMA crosses above a slower one it signals growing bullish pressure, and when it crosses below, growing bearish pressure. What Edo EMA Core Cross adds is classifying those crosses into three hierarchies according to which averages are involved, because not all crosses carry the same weight.
THE FIVE EMAs
The five averages form a hierarchy of speeds. The EMA 9 reads immediate momentum; the EMA 20, the short term; the EMA 50, intermediate structure; the EMA 100, background structure; and the EMA 200, the dominant structural bias. Plotted together, they let you read the market as a hierarchical system where short-term moves develop inside larger structural layers. The thickness of each line grows with its weight —the 200 is the thickest— to reinforce the hierarchy visually.
THE HIERARCHICAL CROSS SYSTEM
It is the core of the indicator. Each cross pair is marked with a visual weight proportional to its structural relevance. The cross of the EMA 9 with the EMA 20 corresponds to momentum: fast changes and internal transitions within the prevailing structure, flagged with a small marker. The cross of the EMA 20 with the EMA 50 corresponds to structure: deeper operating rotations and possible mid-structure transitions, with a medium marker. The cross of the EMA 50 with the EMA 200 is the Golden Cross or Death Cross, the heaviest event, the classic structural cross that marks a long-term bias change, with a large marker set apart by its macro importance. This gradation is what turns a pile of EMAs into a structured reading: the size of the marker tells you, without measuring anything, whether what just happened is short-term noise, an operating rotation or a larger structural turn.
MARKERS AND LABELS
Each cross is flagged with an X-marker —below the candle if bullish, above if bearish— and with a readable label that identifies the pair and the direction, for example "9 ↑ 20" for a bullish cross of the 9 over the 20 or "50 ↓ 200" for a Death Cross. Each cross hierarchy can be toggled independently, so the trader can keep only the levels of interest, for example hiding the 9/20 noise and watching only the Golden and Death Cross.
ALERTS
Edo EMA Core Cross includes six alert conditions configurable from the standard TradingView alerts dialog, one bullish and one bearish for each of the three cross hierarchies. In the momentum hierarchy, the bullish alert fires when the 9 crosses above the 20 and the bearish one when it crosses below. In the structure hierarchy, when the 20 crosses above or below the 50. And in the major hierarchy, the Golden Cross when the 50 crosses above the 200 and the Death Cross when it crosses below. The alerts are independent of the visual toggles: they fire even if the corresponding hierarchy is hidden on the chart, so the trader can keep the chart clean and still receive the warning for the level of interest.
HOW TO READ IT
It is worth reading the hierarchy first: before reacting to a cross, look at its size, because a small 9/20 marker is momentum and a large 50/200 marker is structure, and the kind of cross matters more than the cross itself. Then align the speeds by checking the order of the EMAs: when they are stacked from fast to slow in bullish order, the 9 over the 20 over the 50 over the 200, the structure is clean, and when they interleave, the market is in transition. The Golden or Death Cross is contextualized: a 50/200 cross confirms a long-term bias change, but it is not an entry trigger, and it gains value when it coincides with structure and with relevant levels on the chart. Overall, the crosses are used as confirmation and not as anticipation: the indicator visualizes transitions that are already happening, and it serves to align with the structural change, not to front-run it blindly.
ORIGINALITY AND MASHUP JUSTIFICATION
EMAs are a public-domain component and this indicator does not pretend otherwise: it neither renames them nor presents them as something proprietary. The value is not in the averages, but in how they are coordinated. Plotting five EMAs by hand leaves the trader the task of identifying which pair crosses, remembering how much structural weight each pair carries and telling a momentum cross apart from a structural change, a manual, slow and error-prone job in real time. Edo EMA Core Cross solves that with one concrete design decision: ranking the crosses into three tiers and scaling the visual weight of each marker to its structural importance, so the three hierarchies —momentum with the 9/20, structure with the 20/50 and Golden or Death Cross with the 50/200— are read simultaneously and told apart at a glance. That visual coordination of the three hierarchies on a single clean overlay, and not the EMAs separately, is what the indicator contributes.
CONFIGURATION
Show EMA 9 / 20 Cross toggles the momentum hierarchy; Show EMA 20 / 50 Cross, the structure hierarchy; and Show EMA 50 / 200 Cross, the Golden and Death Cross. The colors and thicknesses of the EMAs are customized from the TradingView Style tab.
OPEN SOURCE
Edo EMA Core Cross is published as an open source and free indicator. The full Pine Script is publicly available on TradingView for study, adaptation and integration into any workflow.
This indicator is a technical analysis tool intended exclusively for educational and informational purposes. It does not generate automatic buy or sell signals and should not be considered financial advice. Trading in financial markets carries a significant risk of capital loss. Past results do not guarantee future results. Always use proper risk management.
Script open-source
Dans l'esprit TradingView, le créateur de ce script l'a rendu open source afin que les traders puissent examiner et vérifier ses fonctionnalités. Bravo à l'auteur! Bien que vous puissiez l'utiliser gratuitement, n'oubliez pas que la republication du code est soumise à nos Règles.

EdoLab Markets – Precision Trading Tools
Get Exclusive Indicators:
edolab.io
All content provided is for informational and educational purposes only. Past performance does not guarantee future results.
Get Exclusive Indicators:
edolab.io
All content provided is for informational and educational purposes only. Past performance does not guarantee future results.
Clause de non-responsabilité
Les informations et publications ne sont pas destinées à être, et ne constituent pas, des conseils ou recommandations financiers, d'investissement, de trading ou autres fournis ou approuvés par TradingView. Pour en savoir plus, consultez les Conditions d'utilisation.
Script open-source
Dans l'esprit TradingView, le créateur de ce script l'a rendu open source afin que les traders puissent examiner et vérifier ses fonctionnalités. Bravo à l'auteur! Bien que vous puissiez l'utiliser gratuitement, n'oubliez pas que la republication du code est soumise à nos Règles.
EdoLab Markets – Precision Trading Tools
Get Exclusive Indicators:
edolab.io
All content provided is for informational and educational purposes only. Past performance does not guarantee future results.
Get Exclusive Indicators:
edolab.io
All content provided is for informational and educational purposes only. Past performance does not guarantee future results.
Clause de non-responsabilité
Les informations et publications ne sont pas destinées à être, et ne constituent pas, des conseils ou recommandations financiers, d'investissement, de trading ou autres fournis ou approuvés par TradingView. Pour en savoir plus, consultez les Conditions d'utilisation.