Candle Impedance
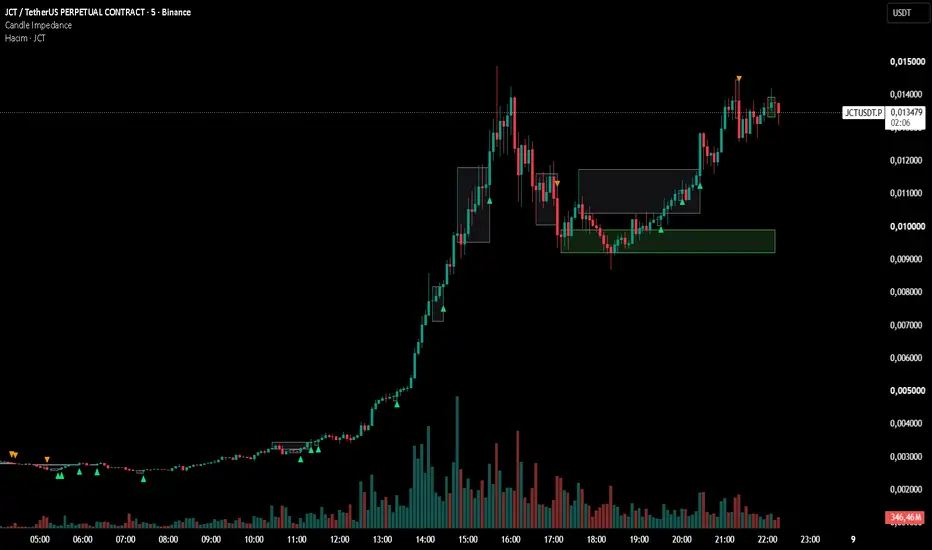
⚡ CANDLE IMPEDANCE: Volume ÷ Move Resistance Boxes
Ever seen a candle with huge volume but almost no price movement? Someone was holding the price back. Candle Impedance finds those candles and turns them into support and resistance boxes on your chart.
🔌 THE IDEA: ELECTRICAL IMPEDANCE FOR THE MARKET
In electronics, impedance is how strongly a circuit opposes current flow, and Ohm's Law (R = V / I) is its simplest form:
• V (voltage) pushes the current
• I (current) is what actually flows
• R (resistance) is how hard the circuit fights back
Apply the same logic to a candle:
• Voltage (V) = Volume (the money pushing the price)
• Current (I) = Move (how far price actually travelled)
• Resistance (R) = Volume / Move
Same voltage, tiny current? The circuit has high resistance. Same logic on the chart: lots of volume, tiny move = the market is opposing the price. That is a "hard" candle.
🧮 HOW IT IS CALCULATED
1. Resistance per candle:
R = Volume / Move
(Move = candle body |close - open|, or full range high - low, your choice)
2. Compare with normal:
Ratio = R / SMA(R, 20)
Raw volume differs on every symbol, so we measure resistance relative to its own 20-bar average.
3. Detect hard candles:
If Ratio > Threshold (default 2.0), the candle faced more than 2x the normal resistance.
Example: a candle with volume 1000 and a body of 1 has R = 1000. If the recent average R is 250, the ratio is 4.0. That is a hard candle.
📦 WHAT YOU SEE ON THE CHART
🔴 RED BOX = Resistance
A bullish candle with high volume but a small rise. Buyers pushed, sellers held the line.
🟢 GREEN BOX = Support
A bearish candle with high volume but a small drop. Sellers pushed, buyers held the line.
⚪ GRAY BOX = Broken zone
Price closed beyond the box, so the blocker gave up. A triangle marker appears:
▲ Resistance broken (closed above a red box)
▼ Support broken (closed below a green box)
Each box is the high-low range of the hard candle and extends to the right until it is broken or expires.
🎯 HOW TO USE IT
• Price approaching a red box: expect possible hesitation, rejection or a pullback.
• Price approaching a green box: expect possible bounce or support.
• Breakout marker: the blocker has given up. A broken level can sometimes act in the opposite role on a retest.
• Combine with trend, structure and your own confirmation. These are zones of interest, not standalone signals.
⚙️ SETTINGS
• Resistance average period: lookback for "normal" resistance (default 20)
• Move measurement: Body or Range (high-low)
• Hard threshold: how many times above average counts as hard (default 2.0). Lower it for more boxes, raise it for fewer and stronger ones.
• Box lifetime: boxes expire after N bars (default 100)
• Max simultaneous boxes: keeps the chart clean (default 15)
• Delete broken boxes: remove them instead of graying them out
• Box colors: fully customizable
💡 TIPS
• Start with threshold 1.5 to 2.0 on lower timeframes, 2.5 to 3.0 if the chart feels crowded.
• "Range" mode reduces false hard candles caused by tiny-bodied candles (dojis).
• Works best on symbols with reliable volume data (stocks, crypto, futures).
• Alerts are available for both resistance and support breakouts.
⚠️ REQUIREMENTS
This indicator needs volume data. On symbols without volume (some indices and forex pairs) it will not work properly.
📜 DISCLAIMER
This indicator is for educational and informational purposes only and does not constitute financial, investment or trading advice. Zones are based on historical volume and price data and do not guarantee future results. Past performance is not indicative of future outcomes. Trading involves significant risk of loss. Always do your own research, use proper risk management and never risk more than you can afford to lose. The author is not responsible for any losses resulting from the use of this script.
Ever seen a candle with huge volume but almost no price movement? Someone was holding the price back. Candle Impedance finds those candles and turns them into support and resistance boxes on your chart.
🔌 THE IDEA: ELECTRICAL IMPEDANCE FOR THE MARKET
In electronics, impedance is how strongly a circuit opposes current flow, and Ohm's Law (R = V / I) is its simplest form:
• V (voltage) pushes the current
• I (current) is what actually flows
• R (resistance) is how hard the circuit fights back
Apply the same logic to a candle:
• Voltage (V) = Volume (the money pushing the price)
• Current (I) = Move (how far price actually travelled)
• Resistance (R) = Volume / Move
Same voltage, tiny current? The circuit has high resistance. Same logic on the chart: lots of volume, tiny move = the market is opposing the price. That is a "hard" candle.
🧮 HOW IT IS CALCULATED
1. Resistance per candle:
R = Volume / Move
(Move = candle body |close - open|, or full range high - low, your choice)
2. Compare with normal:
Ratio = R / SMA(R, 20)
Raw volume differs on every symbol, so we measure resistance relative to its own 20-bar average.
3. Detect hard candles:
If Ratio > Threshold (default 2.0), the candle faced more than 2x the normal resistance.
Example: a candle with volume 1000 and a body of 1 has R = 1000. If the recent average R is 250, the ratio is 4.0. That is a hard candle.
📦 WHAT YOU SEE ON THE CHART
🔴 RED BOX = Resistance
A bullish candle with high volume but a small rise. Buyers pushed, sellers held the line.
🟢 GREEN BOX = Support
A bearish candle with high volume but a small drop. Sellers pushed, buyers held the line.
⚪ GRAY BOX = Broken zone
Price closed beyond the box, so the blocker gave up. A triangle marker appears:
▲ Resistance broken (closed above a red box)
▼ Support broken (closed below a green box)
Each box is the high-low range of the hard candle and extends to the right until it is broken or expires.
🎯 HOW TO USE IT
• Price approaching a red box: expect possible hesitation, rejection or a pullback.
• Price approaching a green box: expect possible bounce or support.
• Breakout marker: the blocker has given up. A broken level can sometimes act in the opposite role on a retest.
• Combine with trend, structure and your own confirmation. These are zones of interest, not standalone signals.
⚙️ SETTINGS
• Resistance average period: lookback for "normal" resistance (default 20)
• Move measurement: Body or Range (high-low)
• Hard threshold: how many times above average counts as hard (default 2.0). Lower it for more boxes, raise it for fewer and stronger ones.
• Box lifetime: boxes expire after N bars (default 100)
• Max simultaneous boxes: keeps the chart clean (default 15)
• Delete broken boxes: remove them instead of graying them out
• Box colors: fully customizable
💡 TIPS
• Start with threshold 1.5 to 2.0 on lower timeframes, 2.5 to 3.0 if the chart feels crowded.
• "Range" mode reduces false hard candles caused by tiny-bodied candles (dojis).
• Works best on symbols with reliable volume data (stocks, crypto, futures).
• Alerts are available for both resistance and support breakouts.
⚠️ REQUIREMENTS
This indicator needs volume data. On symbols without volume (some indices and forex pairs) it will not work properly.
📜 DISCLAIMER
This indicator is for educational and informational purposes only and does not constitute financial, investment or trading advice. Zones are based on historical volume and price data and do not guarantee future results. Past performance is not indicative of future outcomes. Trading involves significant risk of loss. Always do your own research, use proper risk management and never risk more than you can afford to lose. The author is not responsible for any losses resulting from the use of this script.

For help and support, feel free to contact:
wa.me/905469061306
wa.me/905469061306
Clause de non-responsabilité
Les informations et publications ne sont pas destinées à être, et ne constituent pas, des conseils ou recommandations financiers, d'investissement, de trading ou autres fournis ou approuvés par TradingView. Pour en savoir plus, consultez les Conditions d'utilisation.
For help and support, feel free to contact:
wa.me/905469061306
wa.me/905469061306
Clause de non-responsabilité
Les informations et publications ne sont pas destinées à être, et ne constituent pas, des conseils ou recommandations financiers, d'investissement, de trading ou autres fournis ou approuvés par TradingView. Pour en savoir plus, consultez les Conditions d'utilisation.