Mamis Cumulative Line
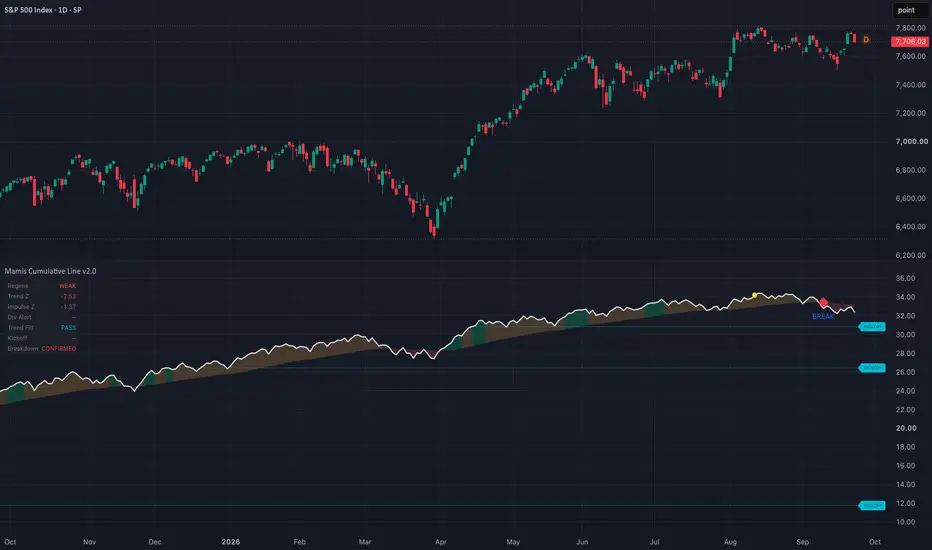
On a standard 1D chart, this indicator combines US breadth trend, thrusts and price divergence. It accumulates (advances − declines) / (advances + declines + unchanged issues) from the selected start year. Missing unchanged-issue data counts as zero.
Defaults use a 50-observation EMA and two observations to confirm regime changes. Green requires breadth at or above its EMA and above its previous three observations; amber stays at or above the EMA without the latter condition; red is below the EMA. Trend Z = (breadth-minus-EMA spread − its 252-observation mean) / its standard deviation.
KICKOFF requires the 10-observation mean breadth ratio’s 252-observation Z-score above 2, raw green conditions, price above its 100-bar EMA and more than 40 chart bars since the last event. Divergence means a higher price high with lower breadth outside green. BREAK adds red conditions, Trend Z below −1 and divergence within 30 bars.
Signals wait for daily close. Default pivots use 10 bars left and confirm five bars after the high; optional placement on the earlier pivot is retrospective. Breadth follows US sessions, so holidays/weekends affect comparisons. Feeds, revisions and loaded history affect results; the live line can change before close.
Defaults use a 50-observation EMA and two observations to confirm regime changes. Green requires breadth at or above its EMA and above its previous three observations; amber stays at or above the EMA without the latter condition; red is below the EMA. Trend Z = (breadth-minus-EMA spread − its 252-observation mean) / its standard deviation.
KICKOFF requires the 10-observation mean breadth ratio’s 252-observation Z-score above 2, raw green conditions, price above its 100-bar EMA and more than 40 chart bars since the last event. Divergence means a higher price high with lower breadth outside green. BREAK adds red conditions, Trend Z below −1 and divergence within 30 bars.
Signals wait for daily close. Default pivots use 10 bars left and confirm five bars after the high; optional placement on the earlier pivot is retrospective. Breadth follows US sessions, so holidays/weekends affect comparisons. Feeds, revisions and loaded history affect results; the live line can change before close.

Clause de non-responsabilité
Les informations et publications ne sont pas destinées à être, et ne constituent pas, des conseils ou recommandations financiers, d'investissement, de trading ou autres fournis ou approuvés par TradingView. Pour en savoir plus, consultez les Conditions d'utilisation.
Clause de non-responsabilité
Les informations et publications ne sont pas destinées à être, et ne constituent pas, des conseils ou recommandations financiers, d'investissement, de trading ou autres fournis ou approuvés par TradingView. Pour en savoir plus, consultez les Conditions d'utilisation.