IANI Liquidity M/W Scalper
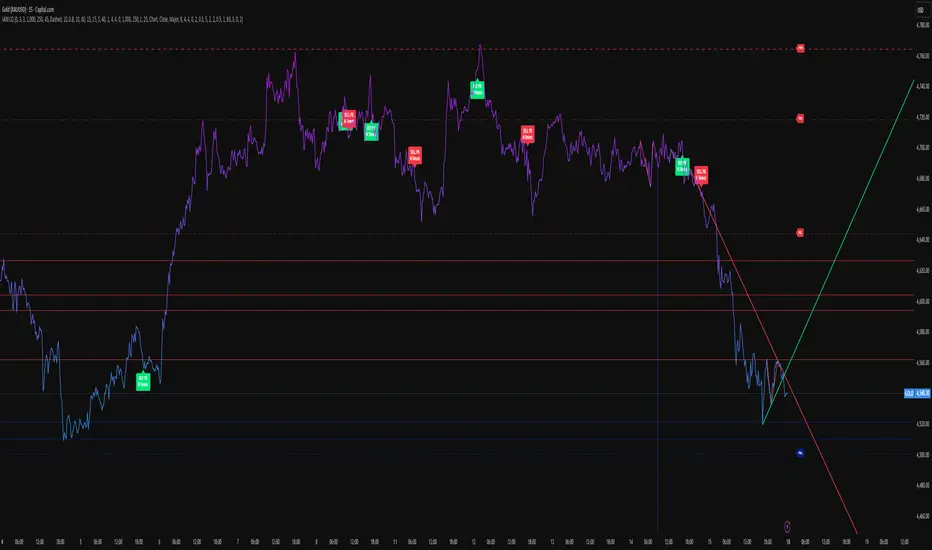
English description
IANI Liquidity M/W Scalper is a price-action scalping indicator designed mainly for low-timeframe execution, especially M1 and M5.
The indicator combines:
liquidity levels: PDH / PDL / PWH / PWL
higher-timeframe support and resistance
local trendline breakout structure
M / W reversal patterns
breakout + pullback / retest logic
optional EMA 50 / EMA 200, hidden by default
The goal is to help identify:
where liquidity is located
where important reaction zones are
where price may reverse or continue
where local breakout structure appears
where a pullback entry may form
How to use — English
1. Start with the main map
First, watch the main liquidity levels:
PDH = Previous Day High
PDL = Previous Day Low
PWH = Previous Week High
PWL = Previous Week Low
These are liquidity areas. Price may move toward them to take liquidity, trigger stops, or react.
2. Use higher-timeframe support and resistance
Support and resistance are calculated from higher timeframes, such as H1.
Basic idea:
near support, look for BUY setups
near resistance, look for SELL setups
after a breakout, watch the next level as a possible target
Do not enter only because price touches a line. Wait for reaction, structure, rejection, or retest.
3. Use the trendline for scalp structure
The trendline is for local scalp structure.
By default, it uses Chart TF:
on M1, it draws trendlines from M1 pivots
on M5, it draws trendlines from M5 pivots
Usage:
green line below price = local bullish structure
break below it = possible SELL watch
red line above price = local bearish structure
break above it = possible BUY watch
4. Use M / W patterns for confirmation
M/W patterns help with reversal setups:
W near support / PDL / liquidity zone = possible BUY
M near resistance / PDH / liquidity zone = possible SELL
The most useful labels are:
BUY PB / W Retest
SELL PB / M Retest
This means the pattern had a breakout and then a pullback/retest.
5. Safer entry workflow
Do not enter every label blindly.
Better process:
1. Price reaches an important area: PDH / PDL / S/R / weekly level
2. Price reacts
3. M or W structure forms
4. Local structure or trendline breaks
5. Wait for pullback / retest
6. Enter with a small SL behind structure
Recommended settings for M1 scalping
Show EMA 50 / EMA 200 = OFF
Show Liquidity Zones = ON
Show Previous Day High / Low = ON
Show Previous Week High / Low = ON
Show Daily Swings = OFF
Show Weekly Swings = OFF
S/R Source TF = 60
Visible S/R Above = 3 or 4
Visible S/R Below = 3 or 4
Trendline Source TF = Chart
Trendline Swing Mode = Major
Show TL Break Labels = OFF
Show M/W Retest Entry Labels = ON
Important
This is not a blind buy/sell system.
Use it with market structure, liquidity, session timing, risk management, and confirmation from price action.
IANI Liquidity M/W Scalper is a price-action scalping indicator designed mainly for low-timeframe execution, especially M1 and M5.
The indicator combines:
liquidity levels: PDH / PDL / PWH / PWL
higher-timeframe support and resistance
local trendline breakout structure
M / W reversal patterns
breakout + pullback / retest logic
optional EMA 50 / EMA 200, hidden by default
The goal is to help identify:
where liquidity is located
where important reaction zones are
where price may reverse or continue
where local breakout structure appears
where a pullback entry may form
How to use — English
1. Start with the main map
First, watch the main liquidity levels:
PDH = Previous Day High
PDL = Previous Day Low
PWH = Previous Week High
PWL = Previous Week Low
These are liquidity areas. Price may move toward them to take liquidity, trigger stops, or react.
2. Use higher-timeframe support and resistance
Support and resistance are calculated from higher timeframes, such as H1.
Basic idea:
near support, look for BUY setups
near resistance, look for SELL setups
after a breakout, watch the next level as a possible target
Do not enter only because price touches a line. Wait for reaction, structure, rejection, or retest.
3. Use the trendline for scalp structure
The trendline is for local scalp structure.
By default, it uses Chart TF:
on M1, it draws trendlines from M1 pivots
on M5, it draws trendlines from M5 pivots
Usage:
green line below price = local bullish structure
break below it = possible SELL watch
red line above price = local bearish structure
break above it = possible BUY watch
4. Use M / W patterns for confirmation
M/W patterns help with reversal setups:
W near support / PDL / liquidity zone = possible BUY
M near resistance / PDH / liquidity zone = possible SELL
The most useful labels are:
BUY PB / W Retest
SELL PB / M Retest
This means the pattern had a breakout and then a pullback/retest.
5. Safer entry workflow
Do not enter every label blindly.
Better process:
1. Price reaches an important area: PDH / PDL / S/R / weekly level
2. Price reacts
3. M or W structure forms
4. Local structure or trendline breaks
5. Wait for pullback / retest
6. Enter with a small SL behind structure
Recommended settings for M1 scalping
Show EMA 50 / EMA 200 = OFF
Show Liquidity Zones = ON
Show Previous Day High / Low = ON
Show Previous Week High / Low = ON
Show Daily Swings = OFF
Show Weekly Swings = OFF
S/R Source TF = 60
Visible S/R Above = 3 or 4
Visible S/R Below = 3 or 4
Trendline Source TF = Chart
Trendline Swing Mode = Major
Show TL Break Labels = OFF
Show M/W Retest Entry Labels = ON
Important
This is not a blind buy/sell system.
Use it with market structure, liquidity, session timing, risk management, and confirmation from price action.

SLTP
Clause de non-responsabilité
Les informations et publications ne sont pas destinées à être, et ne constituent pas, des conseils ou recommandations financiers, d'investissement, de trading ou autres fournis ou approuvés par TradingView. Pour en savoir plus, consultez les Conditions d'utilisation.
SLTP
Clause de non-responsabilité
Les informations et publications ne sont pas destinées à être, et ne constituent pas, des conseils ou recommandations financiers, d'investissement, de trading ou autres fournis ou approuvés par TradingView. Pour en savoir plus, consultez les Conditions d'utilisation.