OPEN-SOURCE SCRIPT
RSI with Zone Background Fill
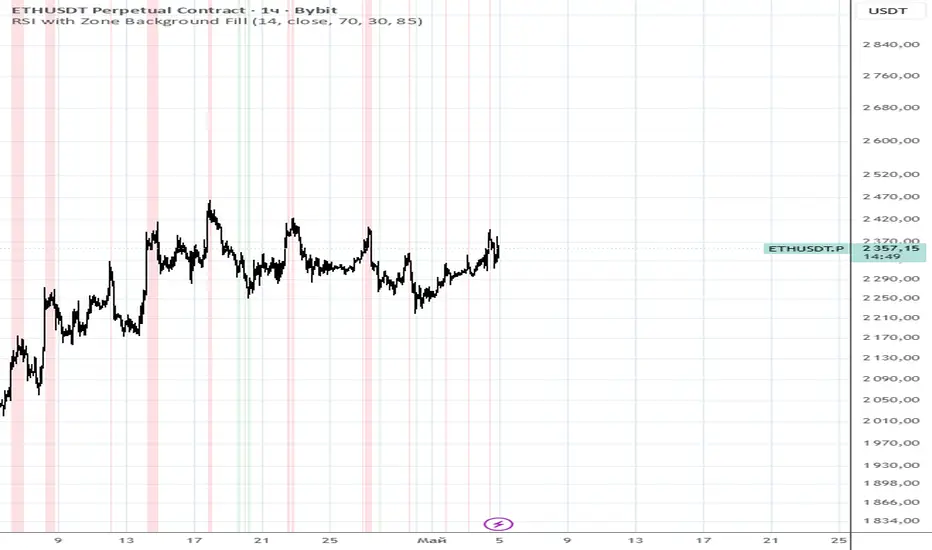
This indicator visually highlights overbought and oversold RSI zones directly on the price chart (since overlay=true).
What it does exactly:
Calculates the standard RSI (period 14, source close).
When RSI is above the specified level (default 70) — the chart background is colored reddish (overbought).
When RSI is below the specified level (default 30) — the background is colored greenish (oversold).
Fill transparency is adjustable (default 85% — barely noticeable).
The RSI line itself is not drawn on the chart (it is only displayed in the Data Window) to avoid cluttering the price chart.
Why it's useful:
To quickly see when the price is in extreme RSI zones without opening a separate indicator window. Convenient for context — for example, to look for reversals or confirm overbought/oversold conditions directly on the candles.https://prnt.sc/LvQLG-ft971R
Script open-source
Dans l'esprit TradingView, le créateur de ce script l'a rendu open source afin que les traders puissent examiner et vérifier ses fonctionnalités. Bravo à l'auteur! Bien que vous puissiez l'utiliser gratuitement, n'oubliez pas que la republication du code est soumise à nos Règles.

Clause de non-responsabilité
Les informations et publications ne sont pas destinées à être, et ne constituent pas, des conseils ou recommandations financiers, d'investissement, de trading ou autres fournis ou approuvés par TradingView. Pour en savoir plus, consultez les Conditions d'utilisation.
Script open-source
Dans l'esprit TradingView, le créateur de ce script l'a rendu open source afin que les traders puissent examiner et vérifier ses fonctionnalités. Bravo à l'auteur! Bien que vous puissiez l'utiliser gratuitement, n'oubliez pas que la republication du code est soumise à nos Règles.
Clause de non-responsabilité
Les informations et publications ne sont pas destinées à être, et ne constituent pas, des conseils ou recommandations financiers, d'investissement, de trading ou autres fournis ou approuvés par TradingView. Pour en savoir plus, consultez les Conditions d'utilisation.