OPEN-SOURCE SCRIPT
Wyckoff Pattern Indicator-AlmostPerfect
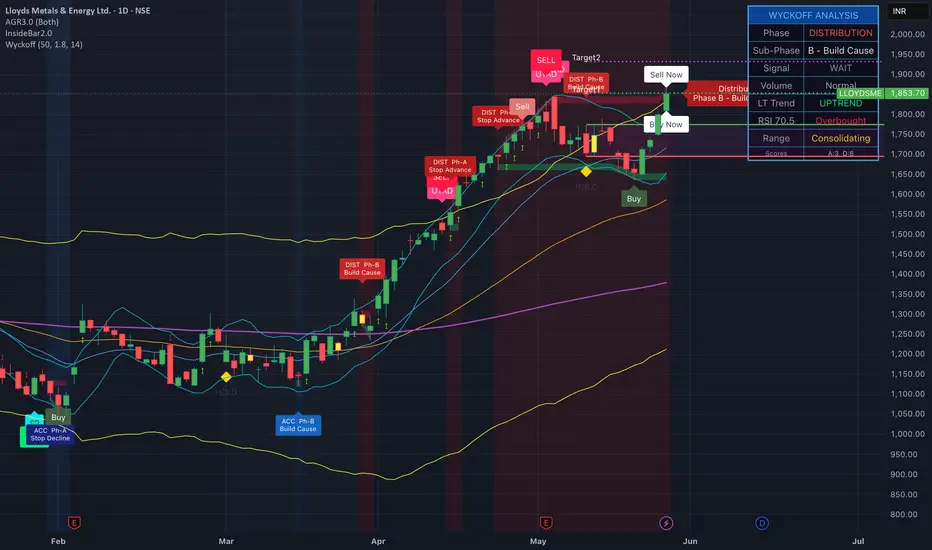
Wyckoff Pattern Indicator — Accumulation & Distribution Phase Tracker
Overview
This indicator automatically identifies **Wyckoff market phases** in real time and plots **BUY, SELL, and HOLD signals** directly on the chart. It works on all timeframes and all instruments (stocks, indices, crypto, forex, commodities).
The Wyckoff Method, developed by Richard Wyckoff in the early 1900s, is one of the most enduring frameworks in technical analysis. It describes how large institutional operators ("Composite Operator") accumulate or distribute positions within a trading range before the next major price move. This indicator brings that logic into a structured, automated form.
How It Works
#### Phase Detection
Every bar is scored across six independent factors:
| Factor | Favours Accumulation | Favours Distribution |
|---|---|---|
| Price position in range | Lower 35% | Upper 65% |
| Long-term trend (EMA 50 vs 200) | Below EMA 200 | Above EMA 200 |
| Consolidation (low realised volatility) | In range | In range |
| Volume dry-up inside range | Yes | Yes |
| RSI | Below 50 | Above 50 |
| MACD histogram slope | Rising | Falling |
A 3-bar consecutive confirmation is required before the phase is declared. This debounce prevents single-bar RSI or MACD wobbles from flipping the phase flag and causing false signals.
Wyckoff Schematic Events Detected
| Label | Event | What it means |
|---|---|---|
| **SC** | Selling Climax | Wide bearish bar on high volume at period low — panic selling exhausted |
| **BC** | Buying Climax | Wide bullish bar on high volume at period high — euphoric buying exhausted |
| **SP** | Spring | Price dips below support then snaps back — a trap for weak hands |
| **UTAD** | Upthrust After Distribution | Price pierces resistance then fails — a bull trap |
| **SOS** | Sign of Strength | Wide up-bar on rising volume breaking short-term resistance |
| **SOW** | Sign of Weakness | Wide down-bar on rising volume breaking short-term support |
| **LPS** | Last Point of Support | Low-volume pullback during mark-up — healthy retest |
| **LPSY** | Last Point of Supply | Low-volume rally during mark-down — weak bounce |
Phase Progression (A → E)
Accumulation Phases
- **Phase A** — Stopping the downtrend (SC, Preliminary Support)
- **Phase B** — Building a cause (secondary tests, range establishing)
- **Phase C** — The spring / shakeout test (potential final trap)
- **Phase D** — Mark-up begins (SOS, LPS sequence)
- **Phase E** — Trending higher out of the trading range
**Distribution Phases**
- **Phase A** — Stopping the uptrend (BC, Preliminary Supply)
- **Phase B** — Building a cause for decline (secondary tests)
- **Phase C** — UTAD / upthrust test (bull trap)
- **Phase D** — Mark-down begins (SOW, LPSY sequence)
- **Phase E** — Trending lower out of the trading range
A label appears **once on the chart at the exact bar the phase transitions** — not on every bar — so the chart stays clean.
Signals
Signals fire only on the **first bar of a new signal state**, not continuously. They will never contradict the phase:
- **▲ BUY** (green) — Fires during Accumulation Phase C or D, on a Spring, or on an LPS. **Completely suppressed during Distribution.**
- **▼ SELL** (red) — Fires during Distribution Phase C or D, on a UTAD, or on an LPSY. **Completely suppressed during Accumulation.**
- **◆ HOLD** (yellow) — Fires when entering Phase B consolidation on either side, or when the range is ambiguous. Means: wait for confirmation.
Supply & Demand Zones
Two shaded bands track the current phase's trading range in real time:
- **Red band (Supply Zone)** — upper boundary of the current phase range
- **Green band (Demand Zone)** — lower boundary of the current phase range
The bands use `plot()` + `fill()` (not static boxes) so they move correctly with any chart pan, zoom, or scroll on all scale modes.
Info Table (top-right)
A live dashboard shows:
- Current major phase (Accumulation / Distribution / Neutral)
- Sub-phase (A through E)
- Active signal
- Volume condition (Climax / Dry-Up / Normal)
- Long-term trend
- RSI reading
- Consolidation / Trending status
- Raw Accumulation and Distribution scores
Settings
| Setting | Default | Description |
|---|---|---|
| Lookback Period | 50 | Bars used to define the trading range high/low |
| Volume Climax Multiplier | 1.8× | How many times avg volume = climax |
| RSI Length | 14 | RSI period |
| Phase Background | On | Blue/red background shading per phase |
| Show Wyckoff Events | On | SC, BC, SP, UTAD, SOS, SOW markers |
| Show Buy/Sell Signals | On | BUY / SELL / HOLD labels |
| Show Phase Labels | On | Phase transition labels on candles |
| Show Supply/Demand Zones | On | Red/green zone bands |
| Show EMAs | On | EMA 20 / 50 / 200 |
Alerts
Nine alert conditions are built in:
- Wyckoff BUY / SELL / HOLD
- Spring detected
- UTAD detected
- Selling Climax / Buying Climax
- Sign of Strength / Sign of Weakness
Important Notes
- This indicator is based on **pattern recognition and scoring**, not exact Wyckoff schematic fitting. It is a decision-support tool, not a mechanical trading system.
- Always confirm signals with **volume context** and **broader market structure** before trading.
- On lower timeframes (1m–5m), increase the Lookback Period to reduce noise.
- On higher timeframes (Daily+), the phase transitions are more reliable and slower-moving.
---
*Based on the Wyckoff Market Cycle framework developed by Richard D. Wyckoff (1873–1934).*
Overview
This indicator automatically identifies **Wyckoff market phases** in real time and plots **BUY, SELL, and HOLD signals** directly on the chart. It works on all timeframes and all instruments (stocks, indices, crypto, forex, commodities).
The Wyckoff Method, developed by Richard Wyckoff in the early 1900s, is one of the most enduring frameworks in technical analysis. It describes how large institutional operators ("Composite Operator") accumulate or distribute positions within a trading range before the next major price move. This indicator brings that logic into a structured, automated form.
How It Works
#### Phase Detection
Every bar is scored across six independent factors:
| Factor | Favours Accumulation | Favours Distribution |
|---|---|---|
| Price position in range | Lower 35% | Upper 65% |
| Long-term trend (EMA 50 vs 200) | Below EMA 200 | Above EMA 200 |
| Consolidation (low realised volatility) | In range | In range |
| Volume dry-up inside range | Yes | Yes |
| RSI | Below 50 | Above 50 |
| MACD histogram slope | Rising | Falling |
A 3-bar consecutive confirmation is required before the phase is declared. This debounce prevents single-bar RSI or MACD wobbles from flipping the phase flag and causing false signals.
Wyckoff Schematic Events Detected
| Label | Event | What it means |
|---|---|---|
| **SC** | Selling Climax | Wide bearish bar on high volume at period low — panic selling exhausted |
| **BC** | Buying Climax | Wide bullish bar on high volume at period high — euphoric buying exhausted |
| **SP** | Spring | Price dips below support then snaps back — a trap for weak hands |
| **UTAD** | Upthrust After Distribution | Price pierces resistance then fails — a bull trap |
| **SOS** | Sign of Strength | Wide up-bar on rising volume breaking short-term resistance |
| **SOW** | Sign of Weakness | Wide down-bar on rising volume breaking short-term support |
| **LPS** | Last Point of Support | Low-volume pullback during mark-up — healthy retest |
| **LPSY** | Last Point of Supply | Low-volume rally during mark-down — weak bounce |
Phase Progression (A → E)
Accumulation Phases
- **Phase A** — Stopping the downtrend (SC, Preliminary Support)
- **Phase B** — Building a cause (secondary tests, range establishing)
- **Phase C** — The spring / shakeout test (potential final trap)
- **Phase D** — Mark-up begins (SOS, LPS sequence)
- **Phase E** — Trending higher out of the trading range
**Distribution Phases**
- **Phase A** — Stopping the uptrend (BC, Preliminary Supply)
- **Phase B** — Building a cause for decline (secondary tests)
- **Phase C** — UTAD / upthrust test (bull trap)
- **Phase D** — Mark-down begins (SOW, LPSY sequence)
- **Phase E** — Trending lower out of the trading range
A label appears **once on the chart at the exact bar the phase transitions** — not on every bar — so the chart stays clean.
Signals
Signals fire only on the **first bar of a new signal state**, not continuously. They will never contradict the phase:
- **▲ BUY** (green) — Fires during Accumulation Phase C or D, on a Spring, or on an LPS. **Completely suppressed during Distribution.**
- **▼ SELL** (red) — Fires during Distribution Phase C or D, on a UTAD, or on an LPSY. **Completely suppressed during Accumulation.**
- **◆ HOLD** (yellow) — Fires when entering Phase B consolidation on either side, or when the range is ambiguous. Means: wait for confirmation.
Supply & Demand Zones
Two shaded bands track the current phase's trading range in real time:
- **Red band (Supply Zone)** — upper boundary of the current phase range
- **Green band (Demand Zone)** — lower boundary of the current phase range
The bands use `plot()` + `fill()` (not static boxes) so they move correctly with any chart pan, zoom, or scroll on all scale modes.
Info Table (top-right)
A live dashboard shows:
- Current major phase (Accumulation / Distribution / Neutral)
- Sub-phase (A through E)
- Active signal
- Volume condition (Climax / Dry-Up / Normal)
- Long-term trend
- RSI reading
- Consolidation / Trending status
- Raw Accumulation and Distribution scores
Settings
| Setting | Default | Description |
|---|---|---|
| Lookback Period | 50 | Bars used to define the trading range high/low |
| Volume Climax Multiplier | 1.8× | How many times avg volume = climax |
| RSI Length | 14 | RSI period |
| Phase Background | On | Blue/red background shading per phase |
| Show Wyckoff Events | On | SC, BC, SP, UTAD, SOS, SOW markers |
| Show Buy/Sell Signals | On | BUY / SELL / HOLD labels |
| Show Phase Labels | On | Phase transition labels on candles |
| Show Supply/Demand Zones | On | Red/green zone bands |
| Show EMAs | On | EMA 20 / 50 / 200 |
Alerts
Nine alert conditions are built in:
- Wyckoff BUY / SELL / HOLD
- Spring detected
- UTAD detected
- Selling Climax / Buying Climax
- Sign of Strength / Sign of Weakness
Important Notes
- This indicator is based on **pattern recognition and scoring**, not exact Wyckoff schematic fitting. It is a decision-support tool, not a mechanical trading system.
- Always confirm signals with **volume context** and **broader market structure** before trading.
- On lower timeframes (1m–5m), increase the Lookback Period to reduce noise.
- On higher timeframes (Daily+), the phase transitions are more reliable and slower-moving.
---
*Based on the Wyckoff Market Cycle framework developed by Richard D. Wyckoff (1873–1934).*
Script open-source
Dans l'esprit TradingView, le créateur de ce script l'a rendu open source afin que les traders puissent examiner et vérifier ses fonctionnalités. Bravo à l'auteur! Bien que vous puissiez l'utiliser gratuitement, n'oubliez pas que la republication du code est soumise à nos Règles.

Founder-CEO - TogetherInvesting Club
942A, Spaze TechPark, Sohna Road, Gurgaon, 122001, India
942A, Spaze TechPark, Sohna Road, Gurgaon, 122001, India
Clause de non-responsabilité
Les informations et publications ne sont pas destinées à être, et ne constituent pas, des conseils ou recommandations financiers, d'investissement, de trading ou autres fournis ou approuvés par TradingView. Pour en savoir plus, consultez les Conditions d'utilisation.
Script open-source
Dans l'esprit TradingView, le créateur de ce script l'a rendu open source afin que les traders puissent examiner et vérifier ses fonctionnalités. Bravo à l'auteur! Bien que vous puissiez l'utiliser gratuitement, n'oubliez pas que la republication du code est soumise à nos Règles.
Founder-CEO - TogetherInvesting Club
942A, Spaze TechPark, Sohna Road, Gurgaon, 122001, India
942A, Spaze TechPark, Sohna Road, Gurgaon, 122001, India
Clause de non-responsabilité
Les informations et publications ne sont pas destinées à être, et ne constituent pas, des conseils ou recommandations financiers, d'investissement, de trading ou autres fournis ou approuvés par TradingView. Pour en savoir plus, consultez les Conditions d'utilisation.