Klinger Volume Oscillator (KVO) + Signals
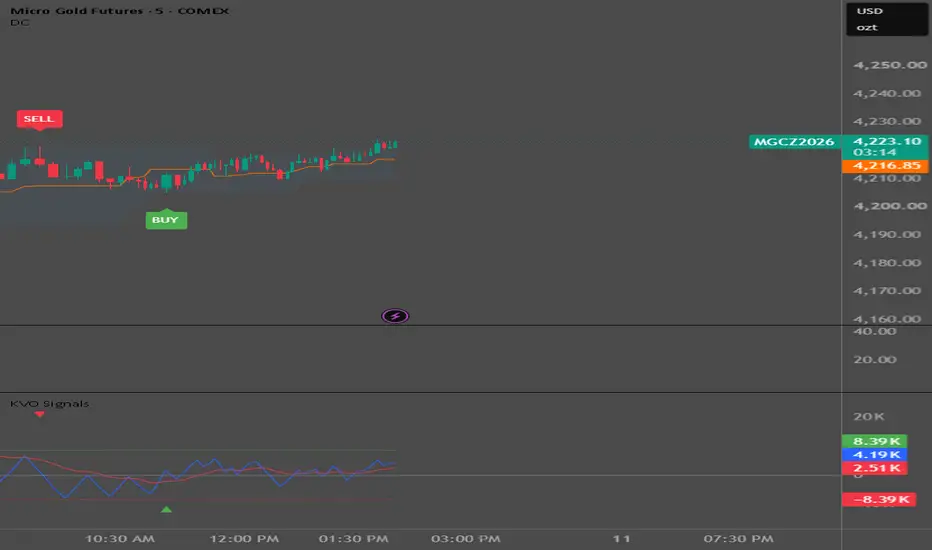
KVO Trade Signals — Klinger Volume Oscillator with Filtered, Confirmed Cross Signals
OVERVIEW
This script adds a tunable buy/sell signal engine to the classic Klinger Volume Oscillator (KVO). The oscillator math is unchanged from the original. What's new is a set of filters and a confirmation step that decide which KVO/Trigger crosses become signals. They are built to separate strong, trending crosses from the weak, back-and-forth crosses that show up in choppy markets.
CREDIT
The Klinger Volume Oscillator calculation in this script comes from HPotter's open-source "Klinger Volume Oscillator (KVO)" v1.0 on TradingView. All credit for the original indicator goes to HPotter, and for the underlying concept to Stephen Klinger, who created the Klinger Volume Oscillator. HPotter's default lengths of 34 (fast), 55 (slow) and 13 (trigger) are kept. This version ports that code to Pine Script v6 and adds the signal, filter, confirmation and diagnostic layers described below. Like the original, it is published open-source.
HOW IT WORKS
• Blue line = KVO (fast EMA minus slow EMA of signed volume). Red line = Trigger (EMA of KVO).
• SELL candidate: Blue crosses DOWN through Red.
• BUY candidate: Blue crosses UP through Red.
• A candidate becomes a signal only if it passes every enabled filter and then the confirmation check.
Raw KVO values are in volume units, so they vary hugely between symbols and timeframes. To keep the settings portable, every filter is measured as a percentage of the KVO's own standard deviation over the Normalization Lookback. For example, 100% means "one standard deviation." The same settings mean roughly the same thing on any chart.
Signals appear as BUY/SELL labels on the price chart and as small triangles in the oscillator pane. You can turn each display on or off.
━━━━━━━━━━━━━━━━━━━━━━━━━━━━━━
INPUTS — THE LEVERS AND DIALS
━━━━━━━━━━━━━━━━━━━━━━━━━━━━━━
KVO LENGTHS
• Trigger / Fast / Slow Length (13 / 34 / 55): the standard KVO settings. Leave these alone unless you deliberately want a faster or slower oscillator.
SIGNAL FILTERS (units = % of KVO std dev)
• Normalization Lookback (200 bars): the window used to measure KVO's standard deviation. Every "%" setting below is relative to it. Longer = steadier scale. Shorter = adapts faster to changing volume regimes.
• Use zero-line filter (on): requires crosses to happen on the "stretched" side of zero. Sells must happen above zero and buys below.
• Zero-Line Distance (20%): how far from zero the cross must occur. Sell: Blue must be above +X%. Buy: Blue must be below −X%. The faint red and green lines in the pane show these levels.
– 0 = anywhere on the correct side of zero.
– Negative values let crosses fire slightly on the wrong side. For example, −10 lets a Buy fire up to 10% above zero.
– Turn it off if good signals regularly happen near or across zero on your market.
• Min Run-Up Gap (50%): before the cross, Blue must have been at least this far from Red on the opposite side within the last Run-Up Bars. Good crosses usually come "from a distance," while chop crosses weave in and out of a narrow band. This is usually the most effective chop filter. 0 = off.
• Run-Up Bars (10): how far back the run-up gap is measured.
• Min Cross Strength (0 = off): how quickly the Blue/Red gap opens through the cross, measured as the change in (KVO − Trigger) over Strength Bars. Flat, lazy crosses score low.
• Strength Bars (3): the window for the strength measurement.
CONFIRMATION (blocks barely-crossed fakeouts)
• Confirmation Bars (1): the signal prints this many bars after the cross, and only if Blue stayed on the new side of Red on every bar. 0 = fire on the cross bar itself (fastest, but more fakeouts).
• Min Close-Through Margin (10%): on the signal bar, Blue must be at least this far past Red. 0 = off.
• Signal candle must close in trade direction (on): Buy needs a green candle (close > open) and Sell needs a red one.
TREND FILTER (Donchian midline)
• Use Donchian midline slope (on): Sells only when the Donchian midline is flat or falling, and Buys only when it is flat or rising. This keeps you from fading a channel that is still trending.
• Donchian Length (20): the channel length.
• Slope Lookback (3): compares the current midline with the midline this many bars ago. Shorter lookbacks (2) react faster after V-shaped reversals, where the midline lags.
• Flat Tolerance (0 ticks): a midline change within this many ticks counts as flat.
DISPLAY
• Show signals on price chart / in oscillator pane.
• Show filter values on crosses (for tuning) and Diagnostic label size: see the next section.
━━━━━━━━━━━━━━━━━━━━━━━━━━━━━━
HOW TO TUNE IT
━━━━━━━━━━━━━━━━━━━━━━━━━━━━━━
1. Turn on "Show filter values on crosses (for tuning)". Every Blue/Red cross gets a label with each filter's reading and a ✓ (pass) or ✗ (fail):
– Zero = KVO's position as a signed % of std dev (for example, −85 means 0.85 std dev below zero)
– Gap = the run-up gap %
– Str = cross strength (shown only when that filter is on)
– DC = Donchian slope pass/fail
Blue label = passed all cross filters and is waiting for confirmation. Gray label = blocked.
Orange "no confirm" label = a cross that passed the filters but failed confirmation. It shows the reason: "recrossed" (Blue fell back through Red), "margin N" (not far enough past Red), or "candle" (wrong-colored signal candle).
2. Scroll back through your market and timeframe. Mark the crosses you would have wanted to take and the ones you would have wanted to skip.
3. Compare their numbers. Look for the setting that separates the two groups, and set its threshold between them. In testing, Run-Up Gap was often the clearest difference: wanted crosses showed gaps in the hundreds, while chop crosses were mostly well below that.
4. If a good signal is missing, its label tells you which filter blocked it (the ✗). Loosen only that filter. Common cases:
– Zero ✗ on a good reversal: the oscillator hadn't reached the stretched side yet. Lower or negate Zero-Line Distance, or turn the zero filter off.
– DC ✗ just after a sharp V-bottom or V-top: reduce Slope Lookback to 2, or raise Flat Tolerance.
– Orange "margin": lower Min Close-Through Margin, or use 0 Confirmation Bars.
5. If too many bad signals get through, tighten the filter whose numbers best separate them. That is usually Run-Up Gap first, then Zero-Line Distance or Confirmation.
6. Turn the diagnostics off when you're done. They're for tuning and clutter the chart.
The pane's autoscale can be misleading. A KVO that looks "just above zero" may actually be a full standard deviation above it. Trust the label's Zero % over your eye.
Cross Strength and Run-Up Gap (above/below) are also shown in the Data Window for every bar.
ALERTS
Two alert conditions are included: "KVO Buy" and "KVO Sell". They fire only on fully filtered and confirmed signals. Set alerts to "Once Per Bar Close." Signals are evaluated on the bar's values, so a signal can appear and then disappear while a bar is still forming.
NOTES
• The KVO is volume-based. It needs a symbol with real volume data and is not meaningful on symbols without it.
• The default settings are a starting point, not an optimized set. Market, timeframe and session all change what works, so tune on your own charts.
• This is an analysis tool, not a trading system or financial advice. Past signal behavior does not guarantee future results.
OVERVIEW
This script adds a tunable buy/sell signal engine to the classic Klinger Volume Oscillator (KVO). The oscillator math is unchanged from the original. What's new is a set of filters and a confirmation step that decide which KVO/Trigger crosses become signals. They are built to separate strong, trending crosses from the weak, back-and-forth crosses that show up in choppy markets.
CREDIT
The Klinger Volume Oscillator calculation in this script comes from HPotter's open-source "Klinger Volume Oscillator (KVO)" v1.0 on TradingView. All credit for the original indicator goes to HPotter, and for the underlying concept to Stephen Klinger, who created the Klinger Volume Oscillator. HPotter's default lengths of 34 (fast), 55 (slow) and 13 (trigger) are kept. This version ports that code to Pine Script v6 and adds the signal, filter, confirmation and diagnostic layers described below. Like the original, it is published open-source.
HOW IT WORKS
• Blue line = KVO (fast EMA minus slow EMA of signed volume). Red line = Trigger (EMA of KVO).
• SELL candidate: Blue crosses DOWN through Red.
• BUY candidate: Blue crosses UP through Red.
• A candidate becomes a signal only if it passes every enabled filter and then the confirmation check.
Raw KVO values are in volume units, so they vary hugely between symbols and timeframes. To keep the settings portable, every filter is measured as a percentage of the KVO's own standard deviation over the Normalization Lookback. For example, 100% means "one standard deviation." The same settings mean roughly the same thing on any chart.
Signals appear as BUY/SELL labels on the price chart and as small triangles in the oscillator pane. You can turn each display on or off.
━━━━━━━━━━━━━━━━━━━━━━━━━━━━━━
INPUTS — THE LEVERS AND DIALS
━━━━━━━━━━━━━━━━━━━━━━━━━━━━━━
KVO LENGTHS
• Trigger / Fast / Slow Length (13 / 34 / 55): the standard KVO settings. Leave these alone unless you deliberately want a faster or slower oscillator.
SIGNAL FILTERS (units = % of KVO std dev)
• Normalization Lookback (200 bars): the window used to measure KVO's standard deviation. Every "%" setting below is relative to it. Longer = steadier scale. Shorter = adapts faster to changing volume regimes.
• Use zero-line filter (on): requires crosses to happen on the "stretched" side of zero. Sells must happen above zero and buys below.
• Zero-Line Distance (20%): how far from zero the cross must occur. Sell: Blue must be above +X%. Buy: Blue must be below −X%. The faint red and green lines in the pane show these levels.
– 0 = anywhere on the correct side of zero.
– Negative values let crosses fire slightly on the wrong side. For example, −10 lets a Buy fire up to 10% above zero.
– Turn it off if good signals regularly happen near or across zero on your market.
• Min Run-Up Gap (50%): before the cross, Blue must have been at least this far from Red on the opposite side within the last Run-Up Bars. Good crosses usually come "from a distance," while chop crosses weave in and out of a narrow band. This is usually the most effective chop filter. 0 = off.
• Run-Up Bars (10): how far back the run-up gap is measured.
• Min Cross Strength (0 = off): how quickly the Blue/Red gap opens through the cross, measured as the change in (KVO − Trigger) over Strength Bars. Flat, lazy crosses score low.
• Strength Bars (3): the window for the strength measurement.
CONFIRMATION (blocks barely-crossed fakeouts)
• Confirmation Bars (1): the signal prints this many bars after the cross, and only if Blue stayed on the new side of Red on every bar. 0 = fire on the cross bar itself (fastest, but more fakeouts).
• Min Close-Through Margin (10%): on the signal bar, Blue must be at least this far past Red. 0 = off.
• Signal candle must close in trade direction (on): Buy needs a green candle (close > open) and Sell needs a red one.
TREND FILTER (Donchian midline)
• Use Donchian midline slope (on): Sells only when the Donchian midline is flat or falling, and Buys only when it is flat or rising. This keeps you from fading a channel that is still trending.
• Donchian Length (20): the channel length.
• Slope Lookback (3): compares the current midline with the midline this many bars ago. Shorter lookbacks (2) react faster after V-shaped reversals, where the midline lags.
• Flat Tolerance (0 ticks): a midline change within this many ticks counts as flat.
DISPLAY
• Show signals on price chart / in oscillator pane.
• Show filter values on crosses (for tuning) and Diagnostic label size: see the next section.
━━━━━━━━━━━━━━━━━━━━━━━━━━━━━━
HOW TO TUNE IT
━━━━━━━━━━━━━━━━━━━━━━━━━━━━━━
1. Turn on "Show filter values on crosses (for tuning)". Every Blue/Red cross gets a label with each filter's reading and a ✓ (pass) or ✗ (fail):
– Zero = KVO's position as a signed % of std dev (for example, −85 means 0.85 std dev below zero)
– Gap = the run-up gap %
– Str = cross strength (shown only when that filter is on)
– DC = Donchian slope pass/fail
Blue label = passed all cross filters and is waiting for confirmation. Gray label = blocked.
Orange "no confirm" label = a cross that passed the filters but failed confirmation. It shows the reason: "recrossed" (Blue fell back through Red), "margin N" (not far enough past Red), or "candle" (wrong-colored signal candle).
2. Scroll back through your market and timeframe. Mark the crosses you would have wanted to take and the ones you would have wanted to skip.
3. Compare their numbers. Look for the setting that separates the two groups, and set its threshold between them. In testing, Run-Up Gap was often the clearest difference: wanted crosses showed gaps in the hundreds, while chop crosses were mostly well below that.
4. If a good signal is missing, its label tells you which filter blocked it (the ✗). Loosen only that filter. Common cases:
– Zero ✗ on a good reversal: the oscillator hadn't reached the stretched side yet. Lower or negate Zero-Line Distance, or turn the zero filter off.
– DC ✗ just after a sharp V-bottom or V-top: reduce Slope Lookback to 2, or raise Flat Tolerance.
– Orange "margin": lower Min Close-Through Margin, or use 0 Confirmation Bars.
5. If too many bad signals get through, tighten the filter whose numbers best separate them. That is usually Run-Up Gap first, then Zero-Line Distance or Confirmation.
6. Turn the diagnostics off when you're done. They're for tuning and clutter the chart.
The pane's autoscale can be misleading. A KVO that looks "just above zero" may actually be a full standard deviation above it. Trust the label's Zero % over your eye.
Cross Strength and Run-Up Gap (above/below) are also shown in the Data Window for every bar.
ALERTS
Two alert conditions are included: "KVO Buy" and "KVO Sell". They fire only on fully filtered and confirmed signals. Set alerts to "Once Per Bar Close." Signals are evaluated on the bar's values, so a signal can appear and then disappear while a bar is still forming.
NOTES
• The KVO is volume-based. It needs a symbol with real volume data and is not meaningful on symbols without it.
• The default settings are a starting point, not an optimized set. Market, timeframe and session all change what works, so tune on your own charts.
• This is an analysis tool, not a trading system or financial advice. Past signal behavior does not guarantee future results.

Clause de non-responsabilité
Les informations et publications ne sont pas destinées à être, et ne constituent pas, des conseils ou recommandations financiers, d'investissement, de trading ou autres fournis ou approuvés par TradingView. Pour en savoir plus, consultez les Conditions d'utilisation.
Clause de non-responsabilité
Les informations et publications ne sont pas destinées à être, et ne constituent pas, des conseils ou recommandations financiers, d'investissement, de trading ou autres fournis ou approuvés par TradingView. Pour en savoir plus, consultez les Conditions d'utilisation.