Gap-Body Cancellation Audit
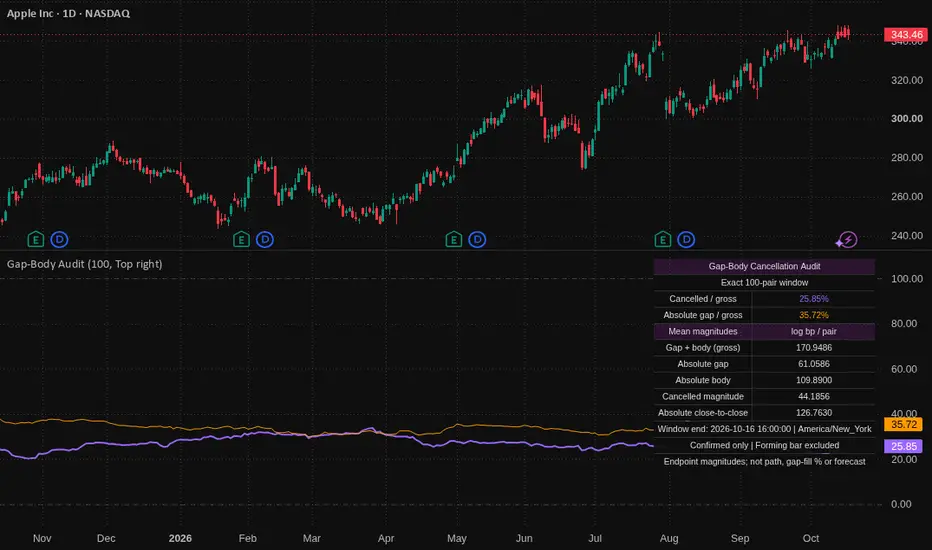
Gap-Body Cancellation Audit
Purpose
A close-to-close return can conceal two opposing endpoint movements: the change from the previous close to the current open, and the change from the current open to the current close. This indicator measures how much of their combined absolute magnitude cancels within each bar pair.
It is a descriptive audit of the selected chart history. It does not generate trades, predict direction, estimate profitability or reconstruct the intrabar price path.
Calculation
For each bar, define:
- Gap component g = ln(current open / previous close)
- Body component b = ln(current close / current open)
- Gross component magnitude = |g| + |b|
- Cancelled magnitude = 2 times the smaller of |g| and |b| when g and b have opposite signs; otherwise zero
- Retained magnitude = |ln(current close / previous close)|
In exact arithmetic, gross = cancelled + retained. The calculation uses natural-log returns because g + b equals the close-to-close log return. Floating-point calculations can leave tiny numerical residuals.
For the most recent N consecutive bar pairs:
- Cancellation share = 100 times the sum of cancelled magnitudes divided by the sum of gross magnitudes
- Gap share = 100 times the sum of absolute gap components divided by the sum of gross magnitudes
The window ratio is magnitude-weighted. It is not an average of individual bar percentages. Cancellation share and gap share have the same denominator and are related descriptions, not independent signals. Cancellation cannot exceed twice the smaller of the gap share and its complement.
Reading the display
The purple line is cancellation share. Zero means the gap and body did not oppose one another in the window. A reading of 100% means nonzero gap/body components completely offset within each included pair. Neither value says what price will do next.
The optional orange line is the absolute gap share. It provides context about the source of the gross component magnitude.
The table shows the latest confirmed window and the mean gross, gap, body, cancelled and absolute close-to-close magnitudes in log basis points per pair. One log basis point is 0.0001 natural-log-return units. These units are not exact ordinary percentage price changes. A very small positive mean is shown as <0.0001 rather than rounded to zero. The Data Window also exposes the numerical accounting residual and validity diagnostics.
A cancellation reading is not a gap-fill percentage. For example, a +0.02 gap log return followed by a -0.01 body log return has gross magnitude 0.03 and cancelled magnitude 0.02, giving 66.67% cancellation. The measure counts both opposing components that net away.
Why this is a separate diagnostic
Gap/body return decomposition is established. This implementation focuses on within-pair cancellation across an exact, validated rolling window, rather than cumulative directional return attribution or the concentration of squared close returns.
For a two-pair example, compare log components:
- A: (+0.005, +0.005), then (+0.005, +0.005)
- B: (+0.025, -0.015), then (-0.015, +0.025)
Both have close returns of +0.01 on each pair, final cumulative gap and body returns of +0.01 each, and 50% absolute gap share. Yet A has 0% cancellation and B has 75%. This shows the diagnostic's specific contribution. It does not establish a new mathematical primitive or global novelty, and the full component histories already contain this information.
Window and confirmation behavior
N pairs require N+1 loaded chart bars. Every included pair needs a strictly positive prior close, current open and current close. Any invalid pair invalidates the exact N-pair window. The script never replaces a bad observation with an older valid one. If the entire window is flat, magnitude totals are zero and percentage shares are undefined.
Plots and Data Window outputs omit the developing bar. The table holds the last confirmed snapshot and identifies its close time in the exchange time zone. It updates when a new bar confirms, including when that new window is invalid. Historical feed corrections, changed session settings and corporate-action adjustments can change recalculated history.
Scope and limitations
Use a standard time-based chart. Synthetic/nonstandard and tick charts are rejected. N means chart bar pairs, not N sessions or a fixed elapsed duration; absent chart bars are not reconstructed.
Here, gap means previous chart close to current chart open. It is not necessarily overnight. Session settings, chart timeframe, data adjustments and contract rollovers affect the components. Continuous-market intraday charts may have very small gaps and correspondingly little cancellation.
The measure uses only these endpoints. It does not use high/low excursions, observe all intervening prices or measure traded volume. Retained magnitude is the sum of absolute individual close returns, not the signed net return across the window. Overlapping windows are not independent samples. No entry, exit, threshold, performance or causal claim is implied.
Implementation checks
The Pine v6 implementation was compiled and its outputs compared with independently recomputed chart exports. The comparison covered 3,455 complete windows across AAPL daily charts at N=1, N=100 and N=1000, plus BTCUSD one-minute charts at N=100, with no mismatches using an absolute tolerance of 0.000001 plus 0.00000001 times the expected value. Counts and validity flags matched exactly. One observed forming-bar export had all ten candidate output cells blank. Live checks also observed the table holding its prior confirmed timestamp through price changes and advancing at the next close.
Separate synthetic tests checked exact-window warmup, flat windows, invalid open/close data, recovery after invalid observations leave the window, confirmed snapshots, and tiny series-valued inputs matching the market-data calculation path. A reload check found identical values in 19,960 output cells across 1,996 shared confirmed bars. These checks validate the tested calculations and display behavior only; results remain subject to the limitations above.
Purpose
A close-to-close return can conceal two opposing endpoint movements: the change from the previous close to the current open, and the change from the current open to the current close. This indicator measures how much of their combined absolute magnitude cancels within each bar pair.
It is a descriptive audit of the selected chart history. It does not generate trades, predict direction, estimate profitability or reconstruct the intrabar price path.
Calculation
For each bar, define:
- Gap component g = ln(current open / previous close)
- Body component b = ln(current close / current open)
- Gross component magnitude = |g| + |b|
- Cancelled magnitude = 2 times the smaller of |g| and |b| when g and b have opposite signs; otherwise zero
- Retained magnitude = |ln(current close / previous close)|
In exact arithmetic, gross = cancelled + retained. The calculation uses natural-log returns because g + b equals the close-to-close log return. Floating-point calculations can leave tiny numerical residuals.
For the most recent N consecutive bar pairs:
- Cancellation share = 100 times the sum of cancelled magnitudes divided by the sum of gross magnitudes
- Gap share = 100 times the sum of absolute gap components divided by the sum of gross magnitudes
The window ratio is magnitude-weighted. It is not an average of individual bar percentages. Cancellation share and gap share have the same denominator and are related descriptions, not independent signals. Cancellation cannot exceed twice the smaller of the gap share and its complement.
Reading the display
The purple line is cancellation share. Zero means the gap and body did not oppose one another in the window. A reading of 100% means nonzero gap/body components completely offset within each included pair. Neither value says what price will do next.
The optional orange line is the absolute gap share. It provides context about the source of the gross component magnitude.
The table shows the latest confirmed window and the mean gross, gap, body, cancelled and absolute close-to-close magnitudes in log basis points per pair. One log basis point is 0.0001 natural-log-return units. These units are not exact ordinary percentage price changes. A very small positive mean is shown as <0.0001 rather than rounded to zero. The Data Window also exposes the numerical accounting residual and validity diagnostics.
A cancellation reading is not a gap-fill percentage. For example, a +0.02 gap log return followed by a -0.01 body log return has gross magnitude 0.03 and cancelled magnitude 0.02, giving 66.67% cancellation. The measure counts both opposing components that net away.
Why this is a separate diagnostic
Gap/body return decomposition is established. This implementation focuses on within-pair cancellation across an exact, validated rolling window, rather than cumulative directional return attribution or the concentration of squared close returns.
For a two-pair example, compare log components:
- A: (+0.005, +0.005), then (+0.005, +0.005)
- B: (+0.025, -0.015), then (-0.015, +0.025)
Both have close returns of +0.01 on each pair, final cumulative gap and body returns of +0.01 each, and 50% absolute gap share. Yet A has 0% cancellation and B has 75%. This shows the diagnostic's specific contribution. It does not establish a new mathematical primitive or global novelty, and the full component histories already contain this information.
Window and confirmation behavior
N pairs require N+1 loaded chart bars. Every included pair needs a strictly positive prior close, current open and current close. Any invalid pair invalidates the exact N-pair window. The script never replaces a bad observation with an older valid one. If the entire window is flat, magnitude totals are zero and percentage shares are undefined.
Plots and Data Window outputs omit the developing bar. The table holds the last confirmed snapshot and identifies its close time in the exchange time zone. It updates when a new bar confirms, including when that new window is invalid. Historical feed corrections, changed session settings and corporate-action adjustments can change recalculated history.
Scope and limitations
Use a standard time-based chart. Synthetic/nonstandard and tick charts are rejected. N means chart bar pairs, not N sessions or a fixed elapsed duration; absent chart bars are not reconstructed.
Here, gap means previous chart close to current chart open. It is not necessarily overnight. Session settings, chart timeframe, data adjustments and contract rollovers affect the components. Continuous-market intraday charts may have very small gaps and correspondingly little cancellation.
The measure uses only these endpoints. It does not use high/low excursions, observe all intervening prices or measure traded volume. Retained magnitude is the sum of absolute individual close returns, not the signed net return across the window. Overlapping windows are not independent samples. No entry, exit, threshold, performance or causal claim is implied.
Implementation checks
The Pine v6 implementation was compiled and its outputs compared with independently recomputed chart exports. The comparison covered 3,455 complete windows across AAPL daily charts at N=1, N=100 and N=1000, plus BTCUSD one-minute charts at N=100, with no mismatches using an absolute tolerance of 0.000001 plus 0.00000001 times the expected value. Counts and validity flags matched exactly. One observed forming-bar export had all ten candidate output cells blank. Live checks also observed the table holding its prior confirmed timestamp through price changes and advancing at the next close.
Separate synthetic tests checked exact-window warmup, flat windows, invalid open/close data, recovery after invalid observations leave the window, confirmed snapshots, and tiny series-valued inputs matching the market-data calculation path. A reload check found identical values in 19,960 output cells across 1,996 shared confirmed bars. These checks validate the tested calculations and display behavior only; results remain subject to the limitations above.

Clause de non-responsabilité
Les informations et publications ne sont pas destinées à être, et ne constituent pas, des conseils ou recommandations financiers, d'investissement, de trading ou autres fournis ou approuvés par TradingView. Pour en savoir plus, consultez les Conditions d'utilisation.
Clause de non-responsabilité
Les informations et publications ne sont pas destinées à être, et ne constituent pas, des conseils ou recommandations financiers, d'investissement, de trading ou autres fournis ou approuvés par TradingView. Pour en savoir plus, consultez les Conditions d'utilisation.