Mis à jour
ATR Move Multiple (X Days)
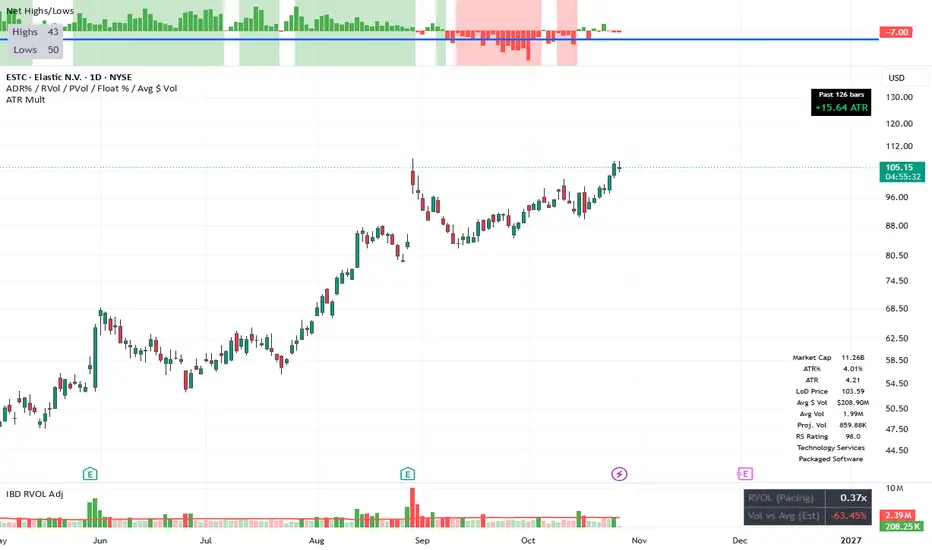
This indicator shows how far a stock (or any ticker) has moved over a chosen number of bars, measured in units of its own average true range (ATR).
It takes the price change from X bars ago to the current bar, divides that change by the ATR (which you can set to any length, default 100), and displays the result as a simple number. A reading of +2.5 means the price is up 2.5 ATRs over that lookback period; –1.8 means it is down 1.8 ATRs.
The number appears in a small table on the chart. You can adjust the lookback length, the ATR period, and the table’s appearance (size, colors, position, border) directly in the indicator settings.
It takes the price change from X bars ago to the current bar, divides that change by the ATR (which you can set to any length, default 100), and displays the result as a simple number. A reading of +2.5 means the price is up 2.5 ATRs over that lookback period; –1.8 means it is down 1.8 ATRs.
The number appears in a small table on the chart. You can adjust the lookback length, the ATR period, and the table’s appearance (size, colors, position, border) directly in the indicator settings.
Notes de version
Added a space above the table so that it wouldn't be blocked by TradingView's built in arrows when hovering your mouse on the chart. 
Clause de non-responsabilité
Les informations et publications ne sont pas destinées à être, et ne constituent pas, des conseils ou recommandations financiers, d'investissement, de trading ou autres fournis ou approuvés par TradingView. Pour en savoir plus, consultez les Conditions d'utilisation.
Clause de non-responsabilité
Les informations et publications ne sont pas destinées à être, et ne constituent pas, des conseils ou recommandations financiers, d'investissement, de trading ou autres fournis ou approuvés par TradingView. Pour en savoir plus, consultez les Conditions d'utilisation.