Uptrick: Adaptive Volatility Trend
Introduction
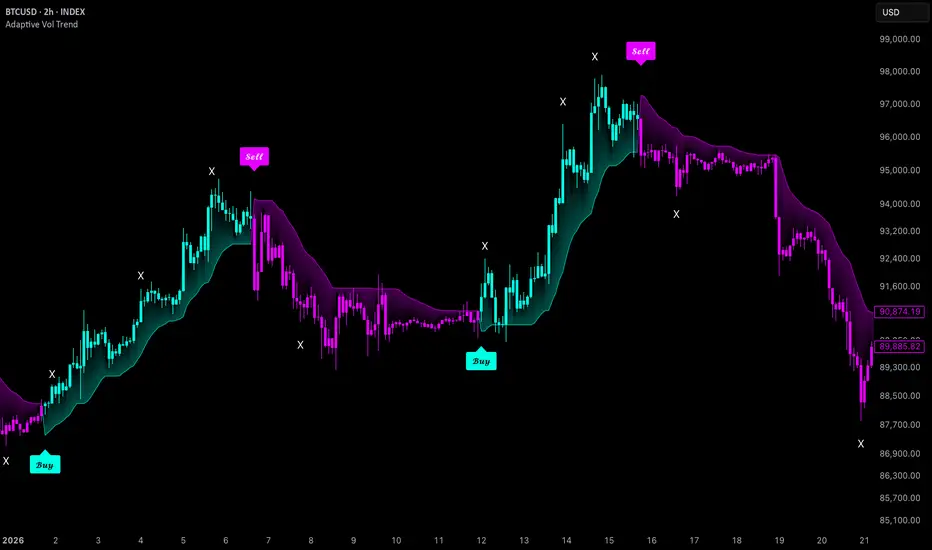
Uptrick: Adaptive Volatility Trend is a trend-following overlay built on an ATR trailing band whose width and baseline speed are both controlled by a single market regime score. Most ATR trail indicators use a fixed multiplier and a fixed baseline, so they are either too tight in choppy markets (frequent whipsaws) or too loose in clean trends (late exits and late entries). This script measures how directional price movement is and whether volatility is expanding, combines those two readings into one regime score between 0 and 1, and uses that score to decide how wide the trail should be and how fast its baseline should react. On top of the trend engine, it includes an optional take profit marking module with fixed ATR targets and an RSI exhaustion target, plus trend candles, a vertical gradient fill and alerts.
Originality
The individual building blocks are classic, public domain concepts: the ATR trailing band logic popularized by the Supertrend indicator, Perry Kaufman's Efficiency Ratio, a ratio of current ATR to its own average, an exponential moving average, and the RSI. What this script does differently is how these parts are tied together and why.
Features
Inputs
01 Color Scheme
02 Adaptive Engine
03 Adaptive Trend
04 Adaptive Basis
05 Signals
06 Take Profits
07 Display
How It Works
How to Use
Conclusion
Uptrick: Adaptive Volatility Trend takes the familiar ATR trailing band and makes both its width and its baseline speed respond to one measurable regime score built from trend efficiency and volatility expansion. The aim is a trail that stays close to price during clean, orderly trends and gives price more room when conditions become noisy or volatile. Volatility-scaled static targets and an RSI exhaustion target round it out as reference points for managing a trend once it has been identified. All regime readings are exposed in the Data Window, so users can see exactly why the trail is behaving the way it is.
Uptrick: Adaptive Volatility Trend is a trend-following overlay built on an ATR trailing band whose width and baseline speed are both controlled by a single market regime score. Most ATR trail indicators use a fixed multiplier and a fixed baseline, so they are either too tight in choppy markets (frequent whipsaws) or too loose in clean trends (late exits and late entries). This script measures how directional price movement is and whether volatility is expanding, combines those two readings into one regime score between 0 and 1, and uses that score to decide how wide the trail should be and how fast its baseline should react. On top of the trend engine, it includes an optional take profit marking module with fixed ATR targets and an RSI exhaustion target, plus trend candles, a vertical gradient fill and alerts.
Originality
The individual building blocks are classic, public domain concepts: the ATR trailing band logic popularized by the Supertrend indicator, Perry Kaufman's Efficiency Ratio, a ratio of current ATR to its own average, an exponential moving average, and the RSI. What this script does differently is how these parts are tied together and why.
- The Efficiency Ratio was chosen because it directly measures whether price is travelling in a straight line or moving back and forth. Low efficiency means noise, which is exactly when a fixed trail gets whipsawed.
- The ATR expansion reading was chosen because a sudden rise in volatility relative to recent history is when a tight trail is most likely to be stopped out by a single large candle. Only expansion is counted; volatility below its average does not add to the score, so quiet markets do not widen the trail.
- These two readings are blended with user-set weights into one smoothed, clamped regime score. That single score then drives two things at once: the ATR multiplier (interpolated between a minimum and a maximum) and the length of the baseline EMA (interpolated between a fast and a slow factor).
- The result is that in efficient, calm trends the baseline speeds up and the trail tightens, while in noisy or expanding conditions the baseline slows down and the trail widens. A standard Supertrend only has a fixed multiplier around a fixed hl2 midpoint, so it cannot do either of these.
- The baseline is a custom EMA of hl2 whose smoothing constant is recalculated on every bar from the adaptive length, rather than a fixed length moving average.
- The RSI take profit module is included because trend-following trails exit late by design. The RSI exhaustion target gives an earlier reference point for partial profit taking within a trend, without changing the trend state itself. The static ATR targets are sized from the ATR at entry so they scale with the volatility present when the signal fired.
Features
- Adaptive ATR trailing band that flips between a bullish lower trail and a bearish upper trail
- Kaufman Efficiency Ratio used to measure how directional or noisy recent price movement is
- Volatility regime reading based on current ATR divided by its average, counting expansion only
- Expansion reading compressed into a 0 to 1 range so extreme spikes cannot dominate the score
- Weighted regime score combining inefficiency and volatility expansion, smoothed and clamped between 0 and 1
- ATR multiplier that scales between a user-defined minimum and maximum based on the regime score
- Adaptive baseline EMA on hl2 whose length scales between a fast and a slow factor based on the regime score
- Ratcheting band memory so the active trail only moves in the direction of the trend until a flip occurs
- Trend flips confirmed only on closed bars, when price closes beyond the opposite band
- Buy and Sell labels on each trend flip, offset from the trail by an adjustable ATR distance
- Take profit module with four modes: Off, Static, Dynamic and Both
- Three static take profit levels placed at fixed ATR multiples from the entry close, using the ATR value at the signal bar
- Each static take profit is marked only once per trend and is checked from the bar after the signal onward
- Dynamic RSI take profit that arms when RSI reaches the exhaustion level and triggers when RSI crosses back out of it
- One dynamic take profit mark per trend
- Take profit hits shown as X markers placed above the high (long) or below the low (short) at an adjustable ATR distance
- Separate visibility toggles for static and dynamic take profit markers
- Optional display of the adaptive baseline
- Vertical gradient fill between the trail and price, strongest at the trail and fading toward price
- Trend candles colored by the current trend direction
- Adjustable trail width and transparency
- Fully customizable bullish, bearish, label text and take profit marker colors
- Data Window readouts for the adaptive ATR multiplier, trend efficiency, volatility ratio and adaptive regime score
- Six alert conditions: Buy, Sell, Static TP1, Static TP2, Static TP3 and Dynamic RSI TP
- Input length safeguards so every length input is treated as at least 1
Inputs
01 Color Scheme
- Bullish Color: color used for the bullish trail, candles, gradient and Buy label
- Bearish Color: color used for the bearish trail, candles, gradient and Sell label
- Buy Text: text color inside the Buy label
- Sell Text: text color inside the Sell label
- TP X Color: color of all take profit X markers
02 Adaptive Engine
- Efficiency Length: lookback for the Efficiency Ratio (default 12)
- Volatility Regime Length: length of the ATR average used for the volatility ratio (default 18)
- Adaptation Smoothing: EMA length used to smooth the volatility score and the final regime score (default 3)
03 Adaptive Trend
- ATR Length: ATR period used for band width, targets and offsets (default 10)
- Minimum ATR Multiplier: band width used when the regime score is 0 (default 1.4)
- Maximum ATR Multiplier: band width used when the regime score is 1 (default 3.0)
- Volatility Influence: weight of volatility expansion in the regime score (default 0.50)
- Efficiency Influence: weight of inefficiency in the regime score (default 0.85)
04 Adaptive Basis
- Basis Length: base length of the adaptive baseline EMA (default 8)
- Fast Regime Factor: length multiplier applied when the regime score is 0 (default 0.40)
- Slow Regime Factor: length multiplier applied when the regime score is 1 (default 1.35)
05 Signals
- Show Buy / Sell: toggles the trend flip labels
- Signal Trail Distance: ATR distance between the trail and the label (default 1.0)
06 Take Profits
- TP Mode: Off, Static, Dynamic or Both (default Static)
- TP1 ATR, TP2 ATR, TP3 ATR: ATR multiples from the entry close for the three static targets (defaults 1.0, 2.5, 3.0)
- TP X Distance: ATR distance of the X marker above the high or below the low (default 0.75)
- Dynamic RSI Length: RSI period for the dynamic target (default 14)
- Long Exhaustion: RSI level that arms the long dynamic target (default 75)
- Short Exhaustion: RSI level that arms the short dynamic target (default 25)
- Static TP Xs: shows or hides static take profit markers
- Dynamic TP Xs: shows or hides dynamic take profit markers
07 Display
- Show Adaptive Trail: toggles the trailing band
- Trail Width: line width of the trail
- Trail Transparency: transparency of the trail
- Show Adaptive Basis: toggles the adaptive baseline (off by default)
- Basis Transparency: transparency of the baseline
- Vertical Price Gradient: toggles the gradient fill between trail and price
- Gradient At Trail: transparency of the gradient at the trail edge
- Trend Candles: toggles trend-colored candles
How It Works
- Trend efficiency is calculated as the absolute net change in close over the efficiency length, divided by the sum of absolute bar-to-bar changes over the same length. A value near 1 means price moved almost in a straight line; a value near 0 means most movement cancelled itself out.
- The volatility ratio is the current ATR divided by the simple moving average of ATR over the volatility regime length. Only the part above 1 is kept (expansion), it is compressed with x / (1 + x) so it stays between 0 and 1, then smoothed with a short EMA.
- The raw regime score is inefficiency (1 minus efficiency) multiplied by the efficiency influence, plus the volatility score multiplied by the volatility influence. It is smoothed with an EMA and clamped between 0 and 1.
- The ATR multiplier is interpolated linearly from the minimum to the maximum multiplier using the regime score.
- The baseline length is the basis length multiplied by a factor interpolated from the fast to the slow regime factor, rounded to a whole number. With default settings this ranges from roughly 3 to 11 bars. The baseline is an EMA of hl2 whose smoothing constant is recalculated from this length on every bar.
- Upper and lower bands are placed at the baseline plus and minus ATR times the adaptive multiplier. The bands use Supertrend-style memory: the lower band can only rise and the upper band can only fall until price closes through them.
- On a confirmed bar, if the trend is bearish and close is above the upper band, the trend flips bullish and a Buy label is printed. If the trend is bullish and close is below the lower band, the trend flips bearish and a Sell label is printed. The active trail is the lower band in a bullish trend and the upper band in a bearish trend.
- When a signal fires, the entry close and the ATR at that bar are stored. Static targets are placed at entry plus or minus ATR times TP1, TP2 and TP3. From the next bar onward, each target is marked once when the bar's high (long) or low (short) reaches it.
- For the dynamic target in a long trend, RSI must first reach the long exhaustion level, then an X is marked when RSI crosses back below it. Short trends use the mirror logic with the short exhaustion level. Only one dynamic target is marked per trend.
- All targets reset when the next opposite signal fires.
How to Use
- Use the trail color and the trend candles as the primary read of trend direction. The trail doubles as a trailing reference level for stops.
- Buy and Sell labels mark confirmed flips. They appear once the bar closes, not intrabar.
- Open the Data Window to see the current regime score, multiplier, efficiency and volatility ratio. A rising regime score means the trail is widening and the baseline is slowing down, which usually happens in choppy or expanding conditions.
- Static targets are useful as fixed, volatility-scaled reference levels for scaling out of a position. The dynamic RSI target is useful as an earlier warning that momentum within the trend has reached an extreme and started to fade.
- If signals are too frequent on your market and timeframe, raise the minimum multiplier or the efficiency influence. If the trail feels too slow, lower the maximum multiplier or the slow regime factor.
- The trend candles are drawn over the chart's native candles. For the cleanest view, you can hide the chart's own candle bodies in the chart settings.
- Set alerts from the alert menu for trend flips and for each take profit event.
- Take profit X markers are visual references only. The indicator does not track positions or exits, and the trend continues until the next opposite signal.
- Like any trend-following tool, the trail lags by design and can produce losing flips in sideways markets.
Conclusion
Uptrick: Adaptive Volatility Trend takes the familiar ATR trailing band and makes both its width and its baseline speed respond to one measurable regime score built from trend efficiency and volatility expansion. The aim is a trail that stays close to price during clean, orderly trends and gives price more room when conditions become noisy or volatile. Volatility-scaled static targets and an RSI exhaustion target round it out as reference points for managing a trend once it has been identified. All regime readings are exposed in the Data Window, so users can see exactly why the trail is behaving the way it is.
Disclaimer
This script is provided for educational and informational purposes only and does not constitute financial advice. Trading involves substantial risk, and past behavior of any indicator does not guarantee future results. Always do your own research and use proper risk management before making any trading decisions.

💎 Free Discord: discord.gg/Def47ueyuD
💎 Website: uptrick.io
Nothing is financial advice. Always do your own research.
💎 Website: uptrick.io
Nothing is financial advice. Always do your own research.
Clause de non-responsabilité
Les informations et publications ne sont pas destinées à être, et ne constituent pas, des conseils ou recommandations financiers, d'investissement, de trading ou autres fournis ou approuvés par TradingView. Pour en savoir plus, consultez les Conditions d'utilisation.
💎 Free Discord: discord.gg/Def47ueyuD
💎 Website: uptrick.io
Nothing is financial advice. Always do your own research.
💎 Website: uptrick.io
Nothing is financial advice. Always do your own research.
Clause de non-responsabilité
Les informations et publications ne sont pas destinées à être, et ne constituent pas, des conseils ou recommandations financiers, d'investissement, de trading ou autres fournis ou approuvés par TradingView. Pour en savoir plus, consultez les Conditions d'utilisation.