OPEN-SOURCE SCRIPT
Thermal Candlestick Spectrogram [Jamallo]
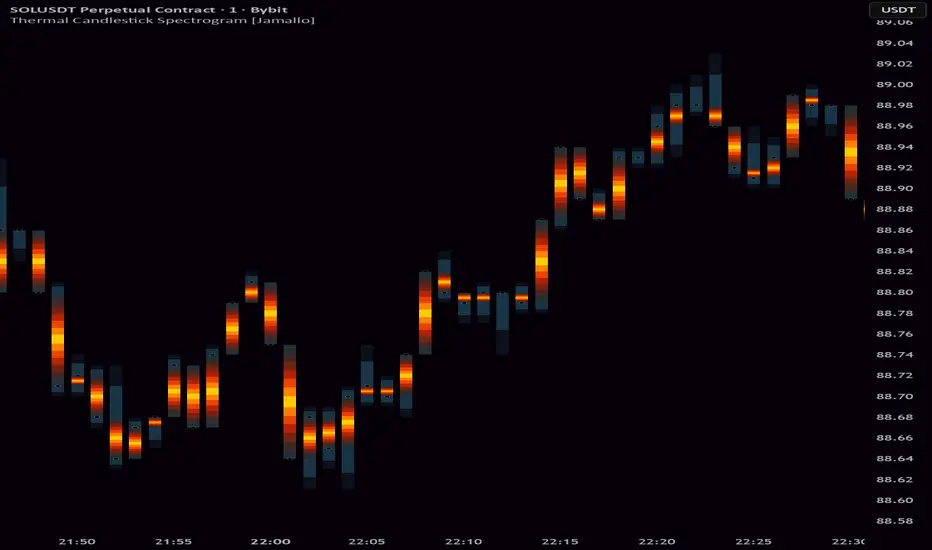
The Thermal Candlestick Spectrogram replaces flat, binary candlesticks with a heat-mapped view of price density. Every bar radiates outward from a white-hot core through layers of orange, red, and deep amber — the same way thermal imaging reveals intensity beneath a surface. The result is a chart that doesn't just show you what price did, it shows you how concentrated that move was.
How It Works
A 7-layer gradient stack is anchored to each candle's midpoint and expands symmetrically toward the edges of the body. Transparency increases with each outer layer, creating a natural falloff that mimics heat dissipation:
White-yellow core — maximum density at the center of the body
Orange-red mantle — transitional layers that reveal the spread of price action
Dark outer boundary — a near-transparent edge that lets candles breathe without hard lines
Fading wicks — a dual-layer vertical fade that tapers wicks naturally toward the High and Low extremes, reducing visual noise
Anti-aliased price dot — a precision close marker with a subtle white halo for clean real-time tracking
Design & Performance
The entire effect runs on a fixed 9-plot architecture (7 body layers + 2 wick layers), keeping script weight low and render performance stable even alongside other indicators. No dynamic loops, no repainting — just a clean, deterministic stack that works across all timeframes and instruments.
Visual Comparison

Traditional flat candles vs. the Thermal Spectrogram — same data, entirely different depth.
How It Works
A 7-layer gradient stack is anchored to each candle's midpoint and expands symmetrically toward the edges of the body. Transparency increases with each outer layer, creating a natural falloff that mimics heat dissipation:
White-yellow core — maximum density at the center of the body
Orange-red mantle — transitional layers that reveal the spread of price action
Dark outer boundary — a near-transparent edge that lets candles breathe without hard lines
Fading wicks — a dual-layer vertical fade that tapers wicks naturally toward the High and Low extremes, reducing visual noise
Anti-aliased price dot — a precision close marker with a subtle white halo for clean real-time tracking
Design & Performance
The entire effect runs on a fixed 9-plot architecture (7 body layers + 2 wick layers), keeping script weight low and render performance stable even alongside other indicators. No dynamic loops, no repainting — just a clean, deterministic stack that works across all timeframes and instruments.
Visual Comparison
Traditional flat candles vs. the Thermal Spectrogram — same data, entirely different depth.
Script open-source
Dans l'esprit TradingView, le créateur de ce script l'a rendu open source afin que les traders puissent examiner et vérifier ses fonctionnalités. Bravo à l'auteur! Bien que vous puissiez l'utiliser gratuitement, n'oubliez pas que la republication du code est soumise à nos Règles.

Join the Growing (Econophysics Trading) Community! ⚛️
discord.com/invite/qb4RKFdwYJ
Trade the physics of price.
discord.com/invite/qb4RKFdwYJ
Trade the physics of price.
Clause de non-responsabilité
Les informations et publications ne sont pas destinées à être, et ne constituent pas, des conseils ou recommandations financiers, d'investissement, de trading ou autres fournis ou approuvés par TradingView. Pour en savoir plus, consultez les Conditions d'utilisation.
Script open-source
Dans l'esprit TradingView, le créateur de ce script l'a rendu open source afin que les traders puissent examiner et vérifier ses fonctionnalités. Bravo à l'auteur! Bien que vous puissiez l'utiliser gratuitement, n'oubliez pas que la republication du code est soumise à nos Règles.
Join the Growing (Econophysics Trading) Community! ⚛️
discord.com/invite/qb4RKFdwYJ
Trade the physics of price.
discord.com/invite/qb4RKFdwYJ
Trade the physics of price.
Clause de non-responsabilité
Les informations et publications ne sont pas destinées à être, et ne constituent pas, des conseils ou recommandations financiers, d'investissement, de trading ou autres fournis ou approuvés par TradingView. Pour en savoir plus, consultez les Conditions d'utilisation.