Mis à jour
Trapped Traders Liquidity Map (Zeiierman)
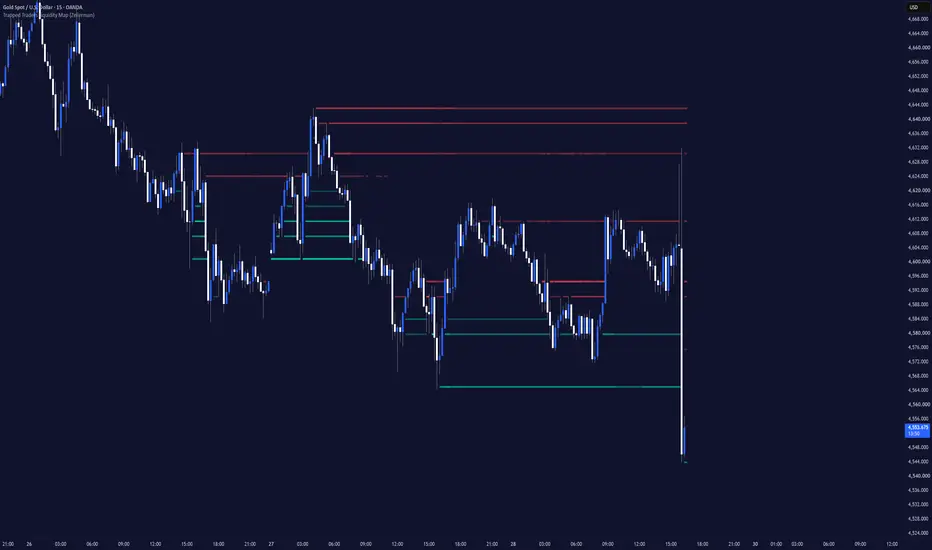
█ Overview
Trapped Traders Liquidity Map (Zeiierman) identifies areas of strong buying and selling pressure and highlights where that pressure may turn into trapped-trader liquidity.
When price closes above an area of strong selling pressure, sellers positioned around that level may become trapped. If price continues holding above the area, short covering, position exits, and stop-loss orders can add further buying pressure to the move.

The opposite applies to strong buying pressure. When price closes below a buying area, buyers may become trapped, and their exits or stop losses can add further selling pressure.

The indicator maps these situations directly on the chart, helping traders identify where the market has pushed through opposing pressure and where trapped positioning may contribute to further movement.

█ Why This One Is Unique
Instead of simply marking traditional support and resistance levels, the Trapped Traders Liquidity Map highlights areas where strong buying or selling pressure entered the market and shows the price levels where those participants may become trapped.
This gives traders a visual view of where buyers or sellers could end up on the wrong side of the market and may be forced to close their positions. Those exits can create additional pressure in the opposite direction, potentially reinforcing the move against the trapped traders.
█ Main Features
⚪ Buying & Selling Pressure Areas
The indicator highlights price areas where aggressive buying or selling activity entered the market and one side clearly dominated the other.
Buying-pressure areas show where buyers were more aggressive than sellers and actively participated at those prices. Selling-pressure areas show where sellers dominated buyers and committed stronger selling activity.

These zones are important because they represent areas where traders took meaningful directional positions. If price later moves and holds against them, those participants may become trapped and eventually be forced to close their positions.
The strength of each area is reflected visually, making it easier to distinguish stronger concentrations of buying or selling pressure from weaker market activity.

█ How to Use
⚪ Trapped Seller Breakouts
Watch for the price to close through a strong selling-pressure area.
When the market breaks above the zone and continues holding above it, sellers who previously defended that area may now be positioned on the wrong side of the move.
As those traders begin covering shorts or triggering stops, their buying can add further pressure in the breakout direction. This can make trapped-seller areas useful as additional confirmation during bullish continuation.
Example 1:

Example 2:

⚪ Trapped Buyer Breakouts
The opposite applies when price closes through a strong buying-pressure area.
If price moves below the zone and continues trading beneath it, buyers around that area may now be trapped.
Position exits and stop losses from those buyers can introduce additional selling activity, providing further pressure in the direction of the breakdown.
Example 1:

Example 2:

⚪ Market Acceptance
Market acceptance can be seen when buyers or sellers continue participating at progressively higher or lower prices, showing that the market is comfortable trading away from the previous value area.
Bullish Acceptance
Buyers continue stepping in at higher prices, while pullbacks hold around newly formed buying-pressure zones. At the same time, price repeatedly pushes into selling-pressure or trapped-seller areas. This shows that buyers remain willing to participate at higher levels and that the market is gradually accepting higher prices.
If this continues, the repeated pressure against trapped sellers can eventually help produce a stronger breakout.

Bearish Acceptance
Sellers continue stepping in at lower prices, while rebounds fail around newly formed selling-pressure zones. At the same time, price repeatedly pushes into buying-pressure or trapped-buyer areas. This shows that sellers remain willing to participate at lower levels and that the market is gradually accepting lower prices.
If this continues, the repeated pressure against trapped buyers can eventually help produce a stronger breakout.

⚪ Liquidity Magnets & Rejections
Trapped-trader and pressure zones can also act as liquidity magnets, attracting price back toward areas where meaningful buying or selling activity previously entered the market.
These levels represent concentrated positioning, so when price returns to them, the market may once again encounter active buyers, sellers, trapped positions, and resting liquidity.
A selling-pressure zone can become especially important when price retests it from below. If buyers push into the area but sellers absorb the buying pressure and price fails to trade through the zone, the rejection can signal that sellers are still defending the level and may lead to a move lower.

The opposite applies to a buying-pressure zone. If price retests the area from above and buyers absorb the incoming selling pressure, a rejection can show that buyers are still defending the level and may support a reversal higher.

The key is to observe how price behaves when it reaches the zone. A strong rejection can indicate that the original pressure remains active, while continued trading through the level may instead begin trapping the traders positioned there.
⚪ Liquidity Clusters
When several trapped-trader areas appear close together, they can form a broader region of concentrated positioning.
These clusters can be especially useful because multiple nearby trapped levels may represent a larger pocket of traders exposed to the same directional move. The greater concentration of trapped positioning can also increase the potential market impact if those traders are later forced to exit, adding stronger buying or selling pressure to future price movement.

⚪ Multi-Timeframe Analysis
The indicator can also be combined across chart timeframes.
Use a higher timeframe to identify larger pressure areas and significant trapped positioning, while a lower timeframe helps show how price behaves as those areas are broken or retested.
This can provide broader structural context while still allowing more precise analysis of the actual trapped-trader event.
█ How It Works
⚪ Cross-Resolution Pressure Model
The indicator processes market activity across multiple internal resolutions and transforms it into a normalized directional pressure field, revealing where participation becomes structurally concentrated.
⚪ Liquidity State Estimation
Buying and selling activity is interpreted through a dynamic state model that evaluates directional dominance, persistence, and displacement relative to the surrounding market environment.
⚪ Trapped Positioning Framework
The system continuously reassesses where directional participants may become structurally misaligned with price, allowing potential trapped positioning to emerge as market conditions evolve.
⚪ Adaptive Significance Mapping
Detected pressure regions are evaluated within a relative significance framework, allowing the map to emphasize areas with stronger structural relevance while suppressing lower-conviction activity.
-----------------
Disclaimer
The content provided in my scripts, indicators, ideas, algorithms, and systems is for educational and informational purposes only. It does not constitute financial advice, investment recommendations, or a solicitation to buy or sell any financial instruments. I will not accept liability for any loss or damage, including without limitation any loss of profit, which may arise directly or indirectly from the use of or reliance on such information.
All investments involve risk, and the past performance of a security, industry, sector, market, financial product, trading strategy, backtest, or individual's trading does not guarantee future results or returns. Investors are fully responsible for any investment decisions they make. Such decisions should be based solely on an evaluation of their financial circumstances, investment objectives, risk tolerance, and liquidity needs.
Trapped Traders Liquidity Map (Zeiierman) identifies areas of strong buying and selling pressure and highlights where that pressure may turn into trapped-trader liquidity.
When price closes above an area of strong selling pressure, sellers positioned around that level may become trapped. If price continues holding above the area, short covering, position exits, and stop-loss orders can add further buying pressure to the move.
The opposite applies to strong buying pressure. When price closes below a buying area, buyers may become trapped, and their exits or stop losses can add further selling pressure.
The indicator maps these situations directly on the chart, helping traders identify where the market has pushed through opposing pressure and where trapped positioning may contribute to further movement.
█ Why This One Is Unique
Instead of simply marking traditional support and resistance levels, the Trapped Traders Liquidity Map highlights areas where strong buying or selling pressure entered the market and shows the price levels where those participants may become trapped.
This gives traders a visual view of where buyers or sellers could end up on the wrong side of the market and may be forced to close their positions. Those exits can create additional pressure in the opposite direction, potentially reinforcing the move against the trapped traders.
█ Main Features
⚪ Buying & Selling Pressure Areas
The indicator highlights price areas where aggressive buying or selling activity entered the market and one side clearly dominated the other.
Buying-pressure areas show where buyers were more aggressive than sellers and actively participated at those prices. Selling-pressure areas show where sellers dominated buyers and committed stronger selling activity.
These zones are important because they represent areas where traders took meaningful directional positions. If price later moves and holds against them, those participants may become trapped and eventually be forced to close their positions.
The strength of each area is reflected visually, making it easier to distinguish stronger concentrations of buying or selling pressure from weaker market activity.
█ How to Use
⚪ Trapped Seller Breakouts
Watch for the price to close through a strong selling-pressure area.
When the market breaks above the zone and continues holding above it, sellers who previously defended that area may now be positioned on the wrong side of the move.
As those traders begin covering shorts or triggering stops, their buying can add further pressure in the breakout direction. This can make trapped-seller areas useful as additional confirmation during bullish continuation.
Example 1:
Example 2:
⚪ Trapped Buyer Breakouts
The opposite applies when price closes through a strong buying-pressure area.
If price moves below the zone and continues trading beneath it, buyers around that area may now be trapped.
Position exits and stop losses from those buyers can introduce additional selling activity, providing further pressure in the direction of the breakdown.
Example 1:
Example 2:
⚪ Market Acceptance
Market acceptance can be seen when buyers or sellers continue participating at progressively higher or lower prices, showing that the market is comfortable trading away from the previous value area.
Bullish Acceptance
Buyers continue stepping in at higher prices, while pullbacks hold around newly formed buying-pressure zones. At the same time, price repeatedly pushes into selling-pressure or trapped-seller areas. This shows that buyers remain willing to participate at higher levels and that the market is gradually accepting higher prices.
If this continues, the repeated pressure against trapped sellers can eventually help produce a stronger breakout.
Bearish Acceptance
Sellers continue stepping in at lower prices, while rebounds fail around newly formed selling-pressure zones. At the same time, price repeatedly pushes into buying-pressure or trapped-buyer areas. This shows that sellers remain willing to participate at lower levels and that the market is gradually accepting lower prices.
If this continues, the repeated pressure against trapped buyers can eventually help produce a stronger breakout.
⚪ Liquidity Magnets & Rejections
Trapped-trader and pressure zones can also act as liquidity magnets, attracting price back toward areas where meaningful buying or selling activity previously entered the market.
These levels represent concentrated positioning, so when price returns to them, the market may once again encounter active buyers, sellers, trapped positions, and resting liquidity.
A selling-pressure zone can become especially important when price retests it from below. If buyers push into the area but sellers absorb the buying pressure and price fails to trade through the zone, the rejection can signal that sellers are still defending the level and may lead to a move lower.
The opposite applies to a buying-pressure zone. If price retests the area from above and buyers absorb the incoming selling pressure, a rejection can show that buyers are still defending the level and may support a reversal higher.
The key is to observe how price behaves when it reaches the zone. A strong rejection can indicate that the original pressure remains active, while continued trading through the level may instead begin trapping the traders positioned there.
⚪ Liquidity Clusters
When several trapped-trader areas appear close together, they can form a broader region of concentrated positioning.
These clusters can be especially useful because multiple nearby trapped levels may represent a larger pocket of traders exposed to the same directional move. The greater concentration of trapped positioning can also increase the potential market impact if those traders are later forced to exit, adding stronger buying or selling pressure to future price movement.
⚪ Multi-Timeframe Analysis
The indicator can also be combined across chart timeframes.
Use a higher timeframe to identify larger pressure areas and significant trapped positioning, while a lower timeframe helps show how price behaves as those areas are broken or retested.
This can provide broader structural context while still allowing more precise analysis of the actual trapped-trader event.
█ How It Works
⚪ Cross-Resolution Pressure Model
The indicator processes market activity across multiple internal resolutions and transforms it into a normalized directional pressure field, revealing where participation becomes structurally concentrated.
⚪ Liquidity State Estimation
Buying and selling activity is interpreted through a dynamic state model that evaluates directional dominance, persistence, and displacement relative to the surrounding market environment.
⚪ Trapped Positioning Framework
The system continuously reassesses where directional participants may become structurally misaligned with price, allowing potential trapped positioning to emerge as market conditions evolve.
⚪ Adaptive Significance Mapping
Detected pressure regions are evaluated within a relative significance framework, allowing the map to emphasize areas with stronger structural relevance while suppressing lower-conviction activity.
-----------------
Disclaimer
The content provided in my scripts, indicators, ideas, algorithms, and systems is for educational and informational purposes only. It does not constitute financial advice, investment recommendations, or a solicitation to buy or sell any financial instruments. I will not accept liability for any loss or damage, including without limitation any loss of profit, which may arise directly or indirectly from the use of or reliance on such information.
All investments involve risk, and the past performance of a security, industry, sector, market, financial product, trading strategy, backtest, or individual's trading does not guarantee future results or returns. Investors are fully responsible for any investment decisions they make. Such decisions should be based solely on an evaluation of their financial circumstances, investment objectives, risk tolerance, and liquidity needs.
Notes de version
Improvements! - Performance Improvements
- Breakout labels added
- Breakout alerts added
Notes de version
Performance Improvements- Easier and more convenient to understand and use
- Enhanced Trapped Traders Calculations
- New Design
Notes de version
Color FixNotes de version
The Trapped Trader is now a fully interactive map that shows where buyers and sellers entered the market. If price moves beyond these key levels, we assume some of those traders have become trapped and may be forced to exit their positions.The idea is to only transact or participate in the market around these key trapped-trader areas, where liquidity and potential reactions are most likely to matter.
Disponible dans l'espace payant
Cet indicateur n'est disponible que pour les abonnés Zeiierman . Abonnez-vous pour accéder à ce script et à d'autres de Zeiierman.

Access my indicators at: zeiierman.com
Join Our Free Discord: discord.gg/zeiiermantrading
Join Our Free Discord: discord.gg/zeiiermantrading
Clause de non-responsabilité
Les informations et publications ne sont pas destinées à être, et ne constituent pas, des conseils ou recommandations financiers, d'investissement, de trading ou autres fournis ou approuvés par TradingView. Pour en savoir plus, consultez les Conditions d'utilisation.
Disponible dans l'espace payant
Cet indicateur n'est disponible que pour les abonnés Zeiierman . Abonnez-vous pour accéder à ce script et à d'autres de Zeiierman.
Access my indicators at: zeiierman.com
Join Our Free Discord: discord.gg/zeiiermantrading
Join Our Free Discord: discord.gg/zeiiermantrading
Clause de non-responsabilité
Les informations et publications ne sont pas destinées à être, et ne constituent pas, des conseils ou recommandations financiers, d'investissement, de trading ou autres fournis ou approuvés par TradingView. Pour en savoir plus, consultez les Conditions d'utilisation.