PROTECTED SOURCE SCRIPT
Mis à jour Swing Data [ATR Ext | RVol | ADR | Ticker/Sector RS]
Disclaimer: This indicator is not financial advice and is strictly for educational and informational purposes only. The metrics and signals provided herein—including ATR extensions, volume projections, and rolling alpha for relative strength — are calculated based on historical market data and do not guarantee future performance. Trading stocks and commodities involves significant risk of loss. The user assumes full responsibility for all trading decisions and should always perform their own due diligence before executing trades.
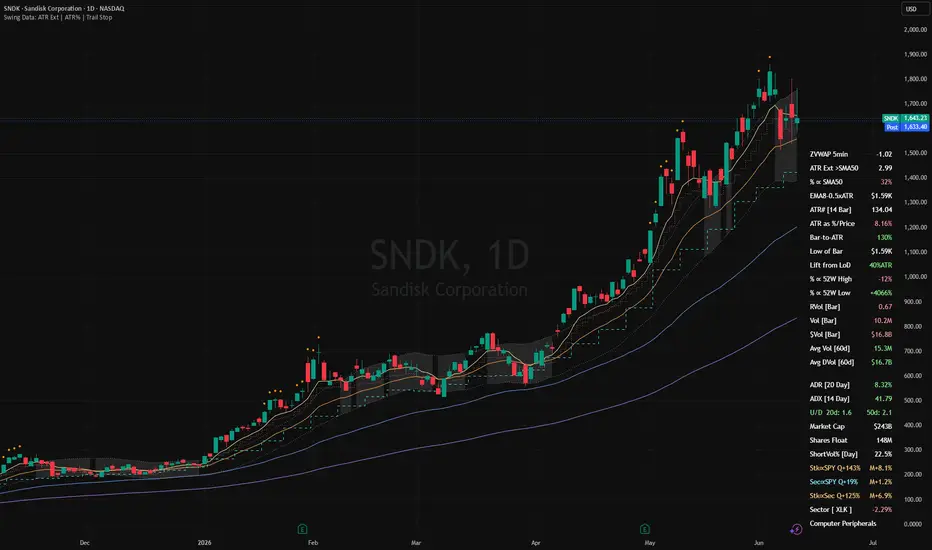
Hello there. I was inspired after reading this Twitter post by Steve Jacobs regarding the ATR Matrix. I followed Steve's recommendation to the interesting [ATR% Multiple from 50-MA] indicator built by Fred6724 for jfsrev but I couldn't match my manual calculations to their math. So, I threw together this TradingView indicator to match my own manual calculations for the ATR Extension Multiple. And then, I added more quality-of-life features that I found useful in my daily workflow such as table positioning, specific data streams, threshold customization, and conditional coloring. This became quite a snowball.
Data streams available for turning on/off:
Advanced mapping of the Sector string to a specific ETF, GICS Compliant.
Pine Script®
Hello there. I was inspired after reading this Twitter post by Steve Jacobs regarding the ATR Matrix. I followed Steve's recommendation to the interesting [ATR% Multiple from 50-MA] indicator built by Fred6724 for jfsrev but I couldn't match my manual calculations to their math. So, I threw together this TradingView indicator to match my own manual calculations for the ATR Extension Multiple. And then, I added more quality-of-life features that I found useful in my daily workflow such as table positioning, specific data streams, threshold customization, and conditional coloring. This became quite a snowball.
- Daily Chart: Please note that the design for this indicator was focused on the daily chart. Edge case testing has not been fully conducted for other charting periods, although the math should apply agnostically. The calculations of rolling alpha for Ticker RS and Sector RS fetch daily data instead of the displayed chart period, which may affect Ticker RS if you have turned on pre-market and after-market.
- Relative Strength Differential reveals rolling alpha: One way to read the Ticker RS and Sector RS is... this stock is beating SPY by +75% in the past 63 days and blue color means the stock's outperformance is accelerating but the sector of this stock is beating SPY by a sleepy 3% and orange color means the sector's performance against the broader market is shrinking... so at a glance, we can conclude this is a strong stock in a lagging sector.
- Status Line: The script outputs the raw ATR Extension value, ATR%, and a Boolean (0/1) for the ATR Extension alert dot directly to the Status Line. This allows you to hover your mouse over any historical candle to see exactly how extended price was on that specific candle, without needing to calculate it manually. These values are coded to display as text only. They provide the data you need without drawing distracting line plots across your price action. In the Style Tab of the indicator settings, you will see checkboxes for these values. Avoid toggling them off and on. Doing so can override the script’s default "invisible" setting and force TradingView to draw unnecessary lines on the chart.
Data streams available for turning on/off:
- ATR Multiple above SMA (default SMA50, default alert on candle >6 multiple, the simple math is Price minus SMA50 and then divide by ATR)
- ATR Percent (default period length 14)
- ATR Value
- Percent Distance from SMA (default SMA50)
- Projected Relative Volume calculated against Average Volume (default 60 day avg vol)
- Projected Volume (estimates end of day volume based on current volume at elapsed time)
- Projected Dollar Volume (estimates end of day turnover based on projected volume x current price... it's a ballpark for gauging liquidity... time arrays for modestly more accurate turnover projection is compute heavy and low signal intel)
- Average Volume (default 60 day)
- Average Dollar Volume (default 60 day)
- ADR Percent (default period length 20 while TradingView prefers 14)
- ADX (default period length 14)
- Low of Day Price
- Dynamic Stop Loss (default Stop MA length 10 and Stop ATR multiple 0.5, adjust at your preference)
- Market Capitalization (calculates latest Fiscal Quarter's Shares Outstanding x Price)
- Ticker RS vs SPY (calculates the stock's 63-day rolling performance against the broader market to quantify raw outperformance percentage; the text color signals velocity, turning default blue if the relative strength is flying above the 21-day average of this relative strength or default orange if shrinking below)
- Sector RS vs SPY (calculates the sector's 63-day rolling performance against the broader market to quantify raw outperformance percentage; the text color signals velocity, turning default blue if the relative strength is flying above the 21-day average of this relative strength or default orange if shrinking below)
- Sector (basic exception handling such as metal/energy/crypto in ambiguous industries and GICS industry overrides, see code block below)
- Industry (pulls TradingView's syminfo, truncates when too long)
Advanced mapping of the Sector string to a specific ETF, GICS Compliant.
Notes de version
IMPROVED FEATURE Advanced Predictive Volume using Bayesian Stabilization One of the biggest challenges with linear volume projections is the "U-Shape" liquidity curve. In the first 30 minutes of the trading day, volume is naturally massive. Standard linear indicators often mistake this normal morning rush for an explosive breakout, projecting unrealistic end-of-day numbers (e.g., 500% Relative Volume) that collapse an 30min later.
Let's fix this using the Time-Weighted Stabilization method. This algorithm uses a Bayesian approach that "anchors" the projection to the stock's 60-day average at the open. As the trading day progresses, the script gradually shifts its weighted trust away from the historical average toward the real-time data using a Square Root Curve. This allows the indicator to filter out early-morning noise while still accelerating quickly enough to catch legitimate breakouts by 10:30 AM ET or 11:00 AM ET. Users can now toggle between "Standard" (Linear) and "Stabilized" modes, and set the initial weight for live volume (default 0.3).
ADDED FEATURE Bearish Pressure via Daily Short Volume
Many traders rely on "Short Interest" to gauge squeeze potential, but that data is reported bi-weekly and is often 10–15 days old by the time you see it. To provide a more immediate signal, let's run a FINRA Daily Short Volume Ratio.
This metric tracks the percentage of today's total volume that was initiated by short sellers. Unlike Short Interest, which measures total open positions, Short Volume measures immediate daily flow. A reading above 50% generally signals aggressive bearish pressure or institutional hedging, while readings below 40% suggest buyers are hitting the ask with little resistance. This calculation is strictly locked to the Daily timeframe to ensure accuracy regardless of the chart you are viewing.
ADDED FEATURE Simple Acc/Dist Ratio
Added the Accumulation/Distribution (Acc/Dist) Ratio to help visualize the "footprint" of big money. This metric looks back over the last 50 days and compares the volume traded on Up Days versus Down Days.
The resulting ratio acts as a conviction gauge for the trend. A value above 1.0 indicates net buying, while a value above 1.2 is a strong signal of institutional support, meaning volume is significantly heavier when the stock is rising than when it is pulling back. Conversely, a value below 1.0 warns of distribution, where sellers are dominating the flow despite price action.
IMPROVED FEATURE Visual Logic for Relative Strength Differential
The visual logic for Ticker and Sector Relative Strength (RS) has been upgraded to filter out "fake" momentum. Previously, a stock could show a "Blue" (Expanding) signal even if it was underperforming the SPY, simply because it was improving slightly.
The new logic implements a strict Noise Filter. If a stock's raw Alpha (performance vs. SPY) is negative, the indicator will now color the value Gray (pick using Trash RS Color), marking it as "Noise" regardless of its short-term momentum. This ensures that the bright "Blue" (Expanding) and "Orange" (Contracting) signals are reserved exclusively for stocks that are actually beating the market.
Notes de version
ADDED FEATURE Bar-to-ATR RatioPrevious metric "ATR Percent" has been renamed more appropriately to "ATR as % / Price", which is a gauge of tightness. Meanwhile, this newly added Bar-to-ATR ratio measures fuel burn of the current candle versus average ATR... a sort of extension risk where the risk-to-reward of a wide stop loss becomes trash on the day of breakout.
ADDED FEATURE Five plot lines for Moving Averages
Everyone loves Moving Averages. One less indicator cluttering the indicator list on my mobile view.
IMPROVED FEATURE Edge Case Handling for the Projected Volume mechanism
Refactored the Projected Volume calculation block to fix critical data distortions when viewing the indicator on Intraday timeframes (e.g., 15m, 1h).
Old Behavior: Ran complex time-weighting math on any chart timeframe. On a 1-hour chart, time_elapsed would be small relative to the 1-hour bar close, but the projection would compare it against Daily Averages, causing mismatched ratios.
New Behavior: The projection logic is now wrapped in a strict timeframe.isdaily check.
Fallback: If the user views the indicator on an Intraday chart, the script defaults vol_proj to the accumulated Daily Volume (d_vol). This disables the "End of Day" forecast on lower timeframes to preserve data integrity.
Explicitly uses d_vol (fetched via request.security), ensuring the calculation base is always the Total Daily Volume, regardless of the chart view.
Condensed the conf_weight and vol_proj_stabilized intermediate variables into a single, cleaner logic block that only executes when valid. This reduces variable clutter and improves script efficiency.
IMPROVED FEATURE Sector Logic Optimization with Static Caching
Refactored the GICS Sector Mapping logic to execute only once upon script initialization, rather than recalculating on every single historical and real-time bar.
Redundant Calculation: The sector of a stock (e.g., Apple is "Technology") never changes during a trading session. However, the original code ran the complex string matching logic (looking for "Silver", "Oil", "REIT", etc.) on every single bar.
Heavy Load: String manipulation functions like str.contains() and str.lower() are computationally expensive. Running these thousands of times (once for every candle on your chart) wastes significant processing power.
The Solution (New Code)
- Static Initialization: Implemented the var keyword to define sec_etf_static. This tells Pine Script to keep the variable's value in memory across all bars, rather than resetting it.
- Execution Gate: Wrapped the entire logic block in if bar_index == 0. This forces the mapping logic to run exactly one time (on the very first bar of history) and never again.
- Persistence: For all subsequent bars, the script simply recalls the saved result (sec_etf = sec_etf_static).
Performance Impact: reduced calculation load of one code section by ~99.9%. The script loads faster, uses less memory, and is far less likely to hit Pine Script execution limits, leaving more resources available for messing around on TradingView.
Notes de version
Interface Definitions & Table Legend- Inputs in menu settings labeled "Lookback" define the period length used for calculations.
- Inputs with "Check" in menu settings establish the specific thresholds that trigger visual alerts or table color changes. Please refer to individual tooltips for detailed logic.
- Table Tags [Day]: Indicates the metric is locked to Daily data, ensuring consistent liquidity and trend analysis regardless of the chart view.
- Table Tags [Bar]: Indicates the metric is Adaptive, calculating values based strictly on the current chart's timeframe (e.g., 65m Volume).
IMPROVED FEATURE Universal Volume Projection Engine
Fully Adaptive: Volume projections now automatically switch behavior based on your chart.
- Intraday (e.g., 65m): Projects the closing volume of the current bar only.
- Daily: Projects the closing volume of the trading session.
- Weekly/Monthly: Projects the end of the period using Fractional Day counting (e.g., Monday Noon = 0.5 days elapsed).
Projection Logic:
- Higher Timeframes (Weekly+): Uses standard Linear Projection, as day-counting is stable and does not require complex filtering.
- Fast Timeframes (Daily/Intraday): Continues to use Bayesian Stabilization (if selected) to filter out "infinite volume" anomalies during the market open.
Fractal RVol: Projected Relative Volume is now mathematically precise for every timeframe. It compares the Projected Volume of the current chart (e.g., 65m) against the Historical Average Volume of that same timeframe (e.g., 65m Average). Note that the Lookback length for the Historical Average Volume can be adjusted, default 60.
Notes de version
IMPROVED FEATURE Hard Lock optional for Moving AveragesDecoupled the Moving Average Ribbon from the chart's native timeframe. You can now hard-lock specific Moving Averages to higher timeframes (e.g., Daily or Weekly) while viewing Intraday charts. Breakout traders live on the Intraday chart (e.g., 65m or 5m) to time entries, but the institutional support lives on the Daily chart. Previously, to see where the "Daily 50 SMA" was while trading a 5-minute chart, you had to switch screens or guess. Now, you can plot the True Daily 50 SMA directly onto your 5-minute execution chart.
When you plot a Daily MA on an Intraday chart, it will not look like a smooth curve. It will look like a Staircase. This is a feature, not a bug. It represents the distinct "Floor" of that day. As long as price action on the 5m chart stays above that "Step," the Daily trend is intact.
If you leave the Timeframe input Empty, the MA behaves exactly as before (calculates based on the chart you are looking at). MTF Behavior gets activated when you select a specific time-frame in the new dropdown to lock that MA to that timeframe, regardless of how far you zoom in.
Config Example for Traders:
- MA 1 (10 SMA): Leave Timeframe Empty. (Tracks immediate momentum on your 5m/65m chart).
- MA 2 (20 SMA): Leave Timeframe Empty. (Tracks the "surf" of the breakout).
- MA 3 (50 SMA): Set Timeframe to "1 Day". (This becomes your "Anchor." It shows the institutional floor you must not violate).
Notes de version
IMPROVED ARCHITECTURE Consolidated Fetch TupleThe previous script made multiple independent request.security() calls to the server to fetch Daily Volume, ADX, ADR, and RS metrics separately. This increases script execution time and server load. The script now uses a custom function f_get_daily_data() to bundle 11 different data points (Volume, Avg Vol, ADR, ADX, Up/Down Vol, 52W High/Low, etc.) into a single tuple. Instead of 5+ separate handshakes with the server, the script now requests everything in one single security call.
IMPROVED ARCHITECTURE Enforcing Measurement on Regular Trading Hours
Calculations for Daily metrics (like ADX or Moving Averages) were performed on whatever data the chart provided. If the user had "Extended Hours" enabled, low-liquidity pre-market candles could skew the averages. The script now explicitly creates an RTH version of the ticker using ticker.modify(syminfo.tickerid, session.regular). All Daily calculations (ADR, ADX, Volume Baselines) now strictly ignore pre-market and after-hours data, even if the user is viewing the chart in Extended Hours mode. This aligns the indicators with how institutions calculate data.
NEW FEATURE Integrated ZVWAP (5min refresh) and Intraday VWAP Plot
Calculates VWAP and Standard Deviation bands (1st, 2nd, 3rd deviations). Displays how many standard deviations the current price is from the VWAP (e.g., Z Score of +2.0 is extended, -2.0 is oversold). The VWAP calculation explicitly forces t_rth on a 5-minute timeframe logic to ensure pre-market trades do not corrupt the VWAP bands.
NEW FEATURE % Distance 52 Week High/Low
Added logic to calculate the distance from the 52-Week High and Low (using a 252-day lookback).
- % to 52W High: Turns green if price is within striking distance (e.g., <10%) of the high.
- % from 52W Low: Alerts if the price is effectively "bottom fishing" (e.g., <50% up from lows).
IMPROVED FEATURE Correcting Short Vol Ratio
FINRA Short Volume data is reported with a 24-hour lag (it is yesterday's data). Comparing Yesterday's Short Volume against Today's Total Volume is mathematically incorrect and leads to volatile, inaccurate ratios intraday. The ratio is now calculated as Yesterday's Short Volume / Yesterday's Total Volume.
IMPROVED FEATURE Expanding the Moving Average Ribbon
Increased the number of available Moving Averages from 5 to 8. Users can now plot a full ribbon (e.g., EMA 8, 21, 34, 55, 89) alongside major SMAs (50, 200) without needing a second indicator.
IMPROVED UI/UX
Further expanded tooltips for "Volume Projection", "ATR Length", and "VWAP" to explain the institutional logic behind the parameters. Inputs are now grouped more tightly using inline="..." parameters to reduce the vertical height of the Settings menu.
Notes de version
<>Notes de version
IMPROVED FEATURE Surge Override added to Volume Projection EngineThe Adaptive Surge Override option has been added. This option defaults to the Bayesian Stabilized method to dampen morning noise. However, if the linear projection exceeds a user-defined Surge Threshold (default 2.0x Average Volume), the script assumes this is not "morning noise" but genuine institutional aggression. It instantly bypasses the dampener and switches to Linear projection to capture the breakout signal without lag.
Sirellia conducted an analysis on 523 triangle breakouts from 2021-2024. Their analysis found real breakouts had a median of 2.8x average 20-day volume. Although my personal preference is averaging volume on a 60-day lookback to prevent memory loss of prior rallies aged over 4 weeks, an optional Surge Threshold is simply good design.
The Surge Threshold completes the adaptive solution to the "Morning Fake-out" problem. Often, retail traders buy the open, spiking volume to 1.5x or 1.8x, but then volume dries up and the stock fails (a "Squat"). The Bayesian model dampens the fake signal. However, if a hedge fund panic-buys a stock at the open, projected volume might hit 3.0x or 4.0x immediately. You do not want to dampen that signal. The Surge Override is your "Emergency Bypass", recognizing that volume this high is more unlikely to be wrong.
Added [ L ] (Linear) and [ B ] (Bayesian) prefixes to the table to indicate which projection method is currently active. No prefix visible means no projection mechanism is active, when markets aren't trading.
NEW FEATURE Ticker vs Sector RS Differential
Added Ticker vs. Sector RS. You can now see if the stock is beating the market (SPY) and its own Sector peer group. "A rising tide lifts all boats," including the leaky ones. During a Semiconductor run, even the bad semi stocks will drift up. But it's better to have Semiconductor leaders during a Semiconductor sector run.
IMPROVED FEATURE Dual TimeFrame for all Relative Strength Differentials
Replaced the 63 day rolling RS differential with a Dual-Timeframe (Fractal) approach. Now includes both Quarterly (Q) 63-Day Rolling Window (Slope context) and Monthly (M) 21-Day Rolling Window (Immediate momentum). Applied to Stock vs SPY, Sector vs SPY, and Stock vs Sector.
Think of the Quarterly (Q) as the direction the car is moving, and the Monthly (M) as how hard the driver is pressing the gas pedal.
- Fresh Breakout (Ideal): Q is slightly positive, but M is significantly higher than Q. (The car is speeding up).
- Tired Leader (Warning): Q is very high (e.g., +20%), but M is lower than Q. (The car is moving fast, but the driver has taken their foot off the gas. It’s coasting and might reverse soon).
- Turnaround Play: Q is negative (long-term downtrend), but M has flipped positive. (The car was reversing, but the driver just shifted into Drive).
NEW FEATURE Lift from Low of Day as
 ATR
ATRCalculates the distance from the current price to the Low of Day (LoD) in units of ATR. Helps quantify risk on entries where the stop is placed at the day's low (e.g., < 0.5 ATR = Sniper Entry).
IMPROVED FEATURE Lookahead Control for all Moving Average lines
Allows users to toggle behavior of Moving Average lines between Smoothed (Repainting/Live-accurate) or Stepped (Non-repainting/Backtest-accurate). This allows the user to choose how Higher Timeframe Moving Averages (e.g., Daily MA on a 65m chart) are rendered.
- ON (Smoothed): The MA line updates dynamically tick-by-tick. This provides a "live" view of where the MA is right now but constitutes "repainting" if analyzing past bars.
- OFF (Stepped): The MA line updates only on the close of the period. This creates a "stair-step" visual that is 100% historically accurate for backtesting but may lag live price action.
If you are on a 1-hour chart and viewing the Daily SMA50:
- Lookahead ON: The line looks smooth and curvy. However, at 10:00 AM, the line is drawn based on where the price will close at 4:00 PM (technically impossible in real-time history, but useful for live projection).
- Lookahead OFF: The line looks like a staircase. For the entire day of trading, the MA value is locked to Yesterday’s close (or the previous confirmed calculation).
- Guidance: Use ON for trading live (it acts as dynamic support/resistance). Use OFF if you are manually backtesting your charts to see "what you would have actually seen" on that specific day.
IMPROVED FEATURE Dual TimeFrame for Up/Down Ratio
Changed label of Accumulation/Distribtion Ratio to Up/Down Ratio, and implemented dual timeframes: Fast (20d) short-term institutional flow and slow (50d) quarterly institutional flow. Conditional color thresholds default green >1.2 and red <0.8.
Dual timeframes can reveal "Distribution in an Uptrend." Sometimes a stock looks fine on the chart, and the 50-day Up/Down ratio is still strong (e.g., 1.5) because of a massive rally two months ago. However, if the 20-day ratio drops below 1.0 or turns Red while the 50-day is Green, it tells you that recently, sellers have taken control, even though the long-term trend looks safe. It is an early warning system for a trend change.
IMPROVED FEATURE GICS Sector Mapping has been Enhanced
Noticed some sectors were showing N/A during my trading. Added support for "Energy", "Carbon", "Blockchain", and "Mining" in description scanning. Fixed mapping for "Producer Manufacturing" (Machinery), "Process Industries" (Chemicals), and "Financial Publishing". Added "Investment Managers" to the ambiguous list to prevent misclassification of asset management firms.
IMPROVED FEATURE Numerical Formatting
Added support for Trillions (T) in Market Cap and Dollar Volume formatting. Implemented "Smart Decimals": Displays 1 decimal place for numbers < 100, and 0 decimals for numbers > 100 to save table space.
MISCELLANEOUS UPDATES
- FINRA Ticker Optimization: Converted FINRA ticker string construction to a var to prevent string reconstruction on every tick.
- Updated tooltips to explain the new "Adaptive" volume logic, the difference between Linear/Bayesian projections, and the new Fractal RS interpretation.
Notes de version
NEW FEATURE Volatility Deviation Bands (pick Bollinger or Keltner)Volatility overlay system has been integrated into the primary chart view, toggle between Keltner Channels (ATR-based) and Bollinger Bands (Standard Deviation-based) for non-intraday timeframes. Thus, VWAP rules intraday timeframes and Deviation Bands rule non-intraday timeframes.
Default set to Keltner on SMA at 1.5 multiplier, intended to compliment my MACD Dive indicator that includes mechanics for the Bollinger-Keltner Squeeze methodology popularized by John Carter and volatility contraction patterns (VCP) championed by Mark Minervini. By setting the default multiplier to 1.5, the script visually identifies the critical threshold where price action transitions from a low-volatility accumulation phase into a high-volatility expansion phase.
Deviation bands can handle dynamic background coloring to provide immediate visual context: green indicates the asset is "riding the bands" in a confirmed uptrend, red indicates a breakdown, and gray signifies a neutral consolidation zone where price wiggle inside the deviation bands. Personally, I prefer not seeing the bands background color when price has escaped the squeeze.
IMPROVED FEATURE Reduced Security Calls from Fractal RS Differential
Underlying data request engine has been refactored to optimize the calculation of Fractal Relative Strength (RS) metrics. Previously, the script utilized separate security calls for the ticker, the SPY benchmark, and the Sector benchmark, which increased the computational load and execution time on TradingView servers. The updated logic bundles the ticker's specific quarterly (63-day) and monthly (21-day) momentum calculations into the primary f_get_daily_data tuple.
IMPROVED FEATURE Safeguards on Volume Projection Algos
Significant safeguards have been added to the volume projection engine to eliminate "ghost signals" that occur during the opening milliseconds of a new bar. In the previous iteration, the linear extrapolation formula (Total Time / Elapsed Time) could produce near-infinite multipliers when Elapsed Time was a fraction of a second, falsely triggering "Ignition" alerts immediately at the bell.
The updated algorithm implements a mathematical clamp (max 600x) and a safety floor (wait at least 1 second at open) for the time denominator. This ensures that Volume Projection data is only presented when statistically significant time has elapsed, preventing traders from reacting to noise caused by data feed latency or millisecond discrepancies at the bar open.
IMPROVED FEATURE Header Prefix for Active Volume Projection
The static "proj" prefix in volume-related table headers (RVol, Vol, $Vol) has been replaced with a context-aware dynamic label. The table now automatically slaps on the "proj" prefix only during active market hours when the algorithm is calculating forward-looking estimates. Once the latest bar closes or for historical data, the prefix is removed, reverting the label to a standard "Vol" or "RVol" descriptor.
This modification ensures zero ambiguity between finalized facts and real-time probabilities. Traders can now instantly distinguish whether the displayed volume data is a confirmed historical print or a live algorithmic projection without checking the market clock.
Notes de version
IMPROVED FEATURE Intraday RVol allows Rolling Avg vs Time-Slot ExpectanceMacro interday charts like Daily or Weekly timeframes will continue utilizing standard Rolling Averages to calculate Relative Volume, which compares current projected volume vs the last N bars immediately preceding the current bar. As a default example, today's projected volume compared against a 60-day average volume provides a standard, reliable baseline. Normal. Simple. Already seamlessly integrates our Linear Projection, Bayesian Stabilization, and Surge Override logic. Great.
However, the denominator of Relative Volume locked to a dumb Rolling Average doesn't always make sense... especially on Intraday charts. Comparing a single 5-minute bar against the rolling average of the preceding 60 x 5min (five hours) fails to account for the consistent rhythms of the trading day. Market volume normally explodes at the open, dries up during the lunch hour, and spikes again into the closing bell. Standard rolling averages trigger massive false Relative Volume spikes at 9:30 AM EST.
To resolve this, Time-Slot Average Expectance is now available for intraday charts. This engine isolates the projected volume of a specific intraday time-slot, such as 10:00 AM to 10:15 AM, and compares it strictly against the historical average volume of that exact same time-slot over a lookback period (default 60-days). A 100,000 share morning spike against a 90,000 share historical morning baseline yields an accurate, calm 1.1x Relative Volume. Midday surges against near-zero historical baselines now instantly trigger as massive anomalies. In other words, timeframes that are shorter than a day now enables two options: the new Time-Slot Expectance or the usual Rolling Average.
Data table now dynamically alters its row prefixes based on selected methodology. Macro charts display a standard "Proj" prefix for daily+ timeframes. Intraday charts adapt directly to menu settings. Selecting the time-slot mode outputs a "Slot" prefix. Selecting the rolling momentum mode outputs a "Roll" prefix.
Executing historical time-slot matching natively in Pine Script risks sever memory limits and compounding data drift. Market halts, early holiday closes, and missing data feeds inevitably misalign standard bar indexing. Simply subtracting a fixed number of bars to find yesterday's 9:35 AM candle will eventually fail and grab the wrong time. Script here resolves this design problem using a custom Dynamic Session Manager combined with an Anchor and Seek algorithm.
The engine logs the exact opening bar index of the active session inside a constrained array. While up to 100 days of historical time-slot matching can be requested, the array memory limit is deliberately capped at 120 elements. This 20-day buffer acts as a strict memory allocation safeguard, preventing memory leak crashes while ensuring the engine never throws an out-of-bounds error when indexing complex disjointed historical data.
Once daily anchors are established, the engine projects an estimated historical index based on today's session depth. Seek algorithm is deployed to scan a highly localized 31-bar window to lock onto the exact minute timestamp. This localization guarantees perfect time alignment despite intraday disruptions. It also acts as an intentional filter limit; if a stock is halted for more than 15 bars in either direction of the target time, the engine skips that specific day rather than risk grabbing corrupted volume data from a post-halt spike.
Scanning thousands of historical bars via loop logic is compute expensive; script will globally cache the resulting time-slot average. Heavy calculation is strictly gated to run only once per bar to prevent Pine Script execution timeouts. New listed assets often lack the required historical data for time-slot matching. This system implements a hardware limit safeguard, which caps the lookback fallback at exactly 4500 bars. If Time-Slot function returns a null value due to missing history, script gracefully fails over to safe rolling average without breaking the chart.
IMPROVED FEATURE Custom Benchmark for Relative Strength
Comparing physical Gold or a micro-cap stock to the S&P 500 provides basic signal intelligence, but we can do better. Instead of being locked to SPY, users can now input custom benchmark tickers like QQQ or IWM or XLK or Silver... or anything.
You chose the ticker. Previously, the benchmark was locked to SPY but now you can also choose the Benchmark (default SPY). The Sector will remain automatic, mapped by my GICS compliant logic chain.
Notes de version
NEW FEATURE Shares Float (Supply Filter)Table now tracks the Shares Float from latest Fiscal Quarter data (the actual number of shares available for public trading), utilizing a smart-fallback to Total Shares if exchange data is delayed or missing.
Float acts as the ultimate supply constraint. By tracking it alongside volume, you can identify "float rotation" which is when intense demand shown by trading volume easily chews through a limited supply, resulting in explosive, parabolic price moves.
The table dynamically color-codes the float size, highlighting highly volatile Micro/Low floats (< 50M) in green, while warning you of sluggish Mega floats (> 500M) in red.
NEW FEATURE Hover Tooltips for Data Table
The data table is no longer just a wall of numbers; it is now an interactive, self-documenting dashboard. Hovering your mouse over a metric in the table will now trigger a tooltip.
Each tooltip clearly breaks down the Math (the exact formula being used), the Context (why the metric matters to price action), and a Color Legend (exactly what Green, White, and Red indicate for that specific row). User no longer need to check the menu settings to understand what a signal means.
IMPROVE FEATURE Various Engine Optimizations
Previously, the 52-Week High/Low metric rigidly looked back 252 trading days. This caused the script to break and display "NaN%" (Not a Number) for recent IPOs or new listings that didn't have enough historical data. The lookback engine is now mathematically adaptive. It counts the available historical bars up to 252. If a stock has only been trading for 40 days, it automatically calculates the high/low relative to those 40 days, allowing you to track momentum on brand-new listings without errors.
The Universal Volume Engine uses a complex "Anchor & Seek" method to perfectly match historical intraday time-slots (e.g., comparing today's 9:35 AM exactly to the last sixty 9:35 AMs). Deep historical scans can occasionally trigger server timeouts or memory limits in TradingView. A strict 4,800-bar history-referencing cap has been hardcoded into the loop. This ensures the script remains lightning-fast and prevent crashes during complex intraday volume projections.
Notes de version
This update reduces load lag and mitigates edge cases that would break pinescript compiler limits. Explicitly reserving 5000-bar memory buffer, providing runway needed for historical volume arrays.Adaptive Scanning for Time Slot
Previously, the intraday Time-Slot "anchor & seek" logic blindly scanned a 31-bar window to match time-slots against historical morning volume. That +/- 15 bars (31 bars total) are necessary on a 1min chart to match against the correct time-slot but causes severe lag on a 65min chart. Now adapts its scan radius based on active intraday chart's timeframe, dropping down to a tight +/- 3 bars (7 bars total) scan window on higher intraday timeframes to slash loop iterations.
In other words, old intraday logic always hunted 100 days x 31 bars = 3100 loops per calculation. New intraday logic on higher intraday time-frames could hunt as low as 100 days x 7 bars = 700 loops. This adaptive scanning slashed compute by almost 80% on swing-trading timeframes. The heaviest Time-Slot calculations are now gated behind a live-edge bypass, meaning the script no longer waste resources calculating arrays on historical bars where the table isn't even displayed.
Better Math in Coding
RS fractal math was rewritten to strip out an unnecessary subtraction node and wraps the historical close references in a null-zero protection function. When you pull up a newly listed IPO with less than 63 days of trading history, the script will no longer crash on a NaN error.
Adding EMA Options for a few metrics
Both the ATR Extension metric and the Dynamic Trailing Stop now have a dropdown toggle to optionally run Exponential Moving Averages. Track explosive, fast-moving momentum breakouts much closer.
VWAP Re-Factor
VWAP engine was re-factored to abandon the heavy, resource-draining cumulative standard deviation loop in favor of an O(1) variance accumulation model. By concurrently tracking the sum of the squared volume-weighted prices, the script calculates the deviation bands instantly.
Better Truncator
Table's text truncator will now cleanly drop the last word of a long industry group name instead of abruptly slicing a word in half.
Script protégé
Ce script est publié en source fermée. Cependant, vous pouvez l'utiliser librement et sans aucune restriction – pour en savoir plus, cliquez ici.

Clause de non-responsabilité
Les informations et publications ne sont pas destinées à être, et ne constituent pas, des conseils ou recommandations financiers, d'investissement, de trading ou autres fournis ou approuvés par TradingView. Pour en savoir plus, consultez les Conditions d'utilisation.
Script protégé
Ce script est publié en source fermée. Cependant, vous pouvez l'utiliser librement et sans aucune restriction – pour en savoir plus, cliquez ici.
Clause de non-responsabilité
Les informations et publications ne sont pas destinées à être, et ne constituent pas, des conseils ou recommandations financiers, d'investissement, de trading ou autres fournis ou approuvés par TradingView. Pour en savoir plus, consultez les Conditions d'utilisation.