ATR Range
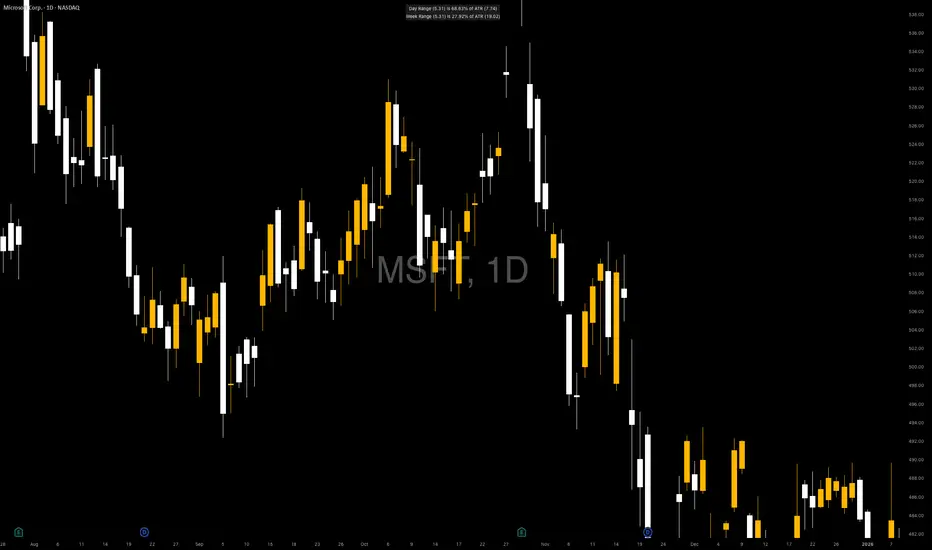
ATR Range is a minimal, clean volatility context indicator designed to show how much of the Daily and Weekly ATR has already been used — without cluttering your chart.
Instead of plotting multiple lines or tables, this indicator displays two simple, highly-informative lines:
• Day Range (X) is Y% of ATR (Z)
• Week Range (X) is Y% of ATR (Z)
These lines update intraday and give you immediate awareness of whether price has already made an average move or still has room to expand.
⸻
🔍 What It Shows
• Daily range vs Daily ATR
• Weekly range vs Weekly ATR
• Percentage of ATR already consumed
⸻
🎯 Why This Is Useful
• Helps avoid chasing extended moves
• Adds volatility context to entries and exits
• Ideal for futures, options, and index trading
Instead of plotting multiple lines or tables, this indicator displays two simple, highly-informative lines:
• Day Range (X) is Y% of ATR (Z)
• Week Range (X) is Y% of ATR (Z)
These lines update intraday and give you immediate awareness of whether price has already made an average move or still has room to expand.
⸻
🔍 What It Shows
• Daily range vs Daily ATR
• Weekly range vs Weekly ATR
• Percentage of ATR already consumed
⸻
🎯 Why This Is Useful
• Helps avoid chasing extended moves
• Adds volatility context to entries and exits
• Ideal for futures, options, and index trading

Clause de non-responsabilité
Les informations et publications ne sont pas destinées à être, et ne constituent pas, des conseils ou recommandations financiers, d'investissement, de trading ou autres fournis ou approuvés par TradingView. Pour en savoir plus, consultez les Conditions d'utilisation.
Clause de non-responsabilité
Les informations et publications ne sont pas destinées à être, et ne constituent pas, des conseils ou recommandations financiers, d'investissement, de trading ou autres fournis ou approuvés par TradingView. Pour en savoir plus, consultez les Conditions d'utilisation.