5 Currency Strength (USDJPY Focus)
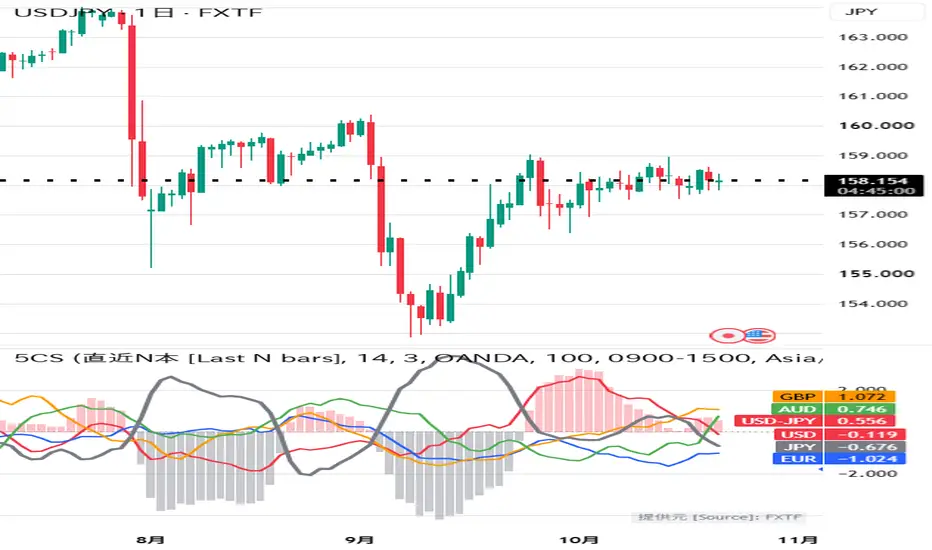
OVERVIEW
This indicator measures the relative strength of five major currencies (USD, EUR, GBP, AUD, JPY) using all 10 pairs that can be formed from them. It is designed mainly for USDJPY traders: in addition to the five strength lines, it plots the strength difference between USD and JPY as columns, so you can see whether a USDJPY move is driven by the dollar side, the yen side, or both.
The indicator does not generate buy/sell signals or alerts. It is a visual tool to help understand currency flows.
HOW IT WORKS
1. Price data
The script requests the close of these 10 pairs on the chart's timeframe:
EURUSD, GBPUSD, AUDUSD, USDJPY, EURGBP, EURAUD, EURJPY, GBPAUD, GBPJPY, AUDJPY.
Prices are always requested with standard candles (ticker.standard), so the values stay the same on Heikin Ashi charts.
2. Change of each pair
For each pair, the log change in percent is calculated:
change = 100 x ln(price / base price)
The base price can be:
- Last N bars: the close N bars ago (default N = 14).
- Session start: the close of the first bar of the selected session (default 09:00-15:00 Asia/Tokyo). All lines start from 0 at the session open.
3. Strength of each currency
Each currency appears in 4 of the 10 pairs. Its strength is the average of those 4 changes, with the sign flipped when the currency is the quote currency. Example:
USD = ( -EURUSD - GBPUSD - AUDUSD + USDJPY ) / 4
JPY = ( -USDJPY - EURJPY - GBPJPY - AUDJPY ) / 4
Because log changes are used, the five strengths always sum to about zero. A line above 0 means that currency is stronger than the average of the others over the selected period.
4. Smoothing
A simple moving average (default 3 bars) is applied. In Session start mode, the smoothing also restarts at the session open, so the first bar of the session is exactly 0.
5. Optional normalization
When "Normalize" is on, each pair's change is divided by its typical volatility:
normalized = change / ( stdev of 1-bar changes over "Normalize length" bars x sqrt(k) )
where k is N (Last N bars mode) or the number of bars since the session open (Session start mode). This keeps the values on a similar scale across timeframes (roughly -2 to +2 in most conditions) and reduces the effect of more volatile pairs.
6. USD-JPY spread
The columns show (USD strength - JPY strength). Positive (light red) means USD is stronger than JPY; negative (light gray) means JPY is stronger than USD.
WHAT IS DIFFERENT FROM A TYPICAL CURRENCY STRENGTH INDICATOR
- USDJPY focus: the USD-JPY strength difference is plotted directly, so you can separate "dollar strength" from "yen weakness".
- Session-start base point: strengths can be reset to 0 at the Tokyo, London or New York open (any session you set), which shows how each currency has moved since the session began.
- Optional volatility normalization, so the scale is comparable between timeframes and pairs.
- Data source follows the chart: by default the 10 pairs are requested from the same data provider as your chart, so prices and timestamps match the symbol you are viewing. The source actually used is shown at the bottom right of the pane.
- Labels on the right are sorted from strongest to weakest and spaced so they do not overlap.
HOW TO USE
- Add it to a forex chart (USDJPY is recommended, but any FX chart works).
- Use "Last N bars" to see the recent balance of strength, or "Session start" on intraday charts to see the flow since a market open.
- Watch the columns to see whether USDJPY is moving because of USD, JPY, or both. For example, rising USDJPY with a small spread and a falling JPY line suggests the move is mainly yen weakness.
- These readings describe past and current price changes only. They do not predict future prices.
INPUTS (Japanese label [English])
Calculation
- 基準点 [Base point]: Last N bars / Session start
- 強弱計算期間 [Lookback period]: N for Last N bars mode
- 滑らかさ [Smoothing]: SMA length
- チャートと同じ提供元を使う [Use chart's data source]: on = use the chart's provider
- データ提供元(手入力) [Data source, manual]: provider used when the option above is off (e.g. OANDA, FX, FOREXCOM)
- 正規化 [Normalize]: volatility normalization on/off
- 正規化の期間 [Normalize length]: bars used for the volatility estimate
Session
- セッション時間 [Session time]: session used for Session start mode
- タイムゾーン [Time zone]: Asia/Tokyo, Europe/London, America/New_York
Display
- USD-JPY 強弱差を表示 [Show USD-JPY spread]: columns on/off
- ラベルの右オフセット [Label offset]: distance of the labels from the last bar
- ラベルの間隔 [Label spacing, smaller = wider]: minimum gap between labels
On-chart texts
- 提供元 [Source]: the data provider actually used
- セッション開始は日中の足でのみ使えます [Session start: intraday only]
LIMITATIONS
- The data provider must offer all 10 pairs. On non-forex charts (for example futures or crypto), turn off "Use chart's data source" and enter a forex provider manually.
- Session start mode works only on intraday timeframes. On daily or higher timeframes the lines are not shown and a notice is displayed.
- On low timeframes such as 1 minute, some pairs may have no trades on some bars. In that case the last known close is used, which can delay the reaction of that pair.
- Values differ slightly between data providers because their prices are not identical.
- Smoothing adds a small delay.
- Historical bars do not change after they close (no lookahead is used). The value of the current, unclosed bar updates in real time until the bar closes.
- Strength is relative: all five lines are measured against each other, so they always balance around zero. A rising line means relative strength, not an absolute rise in value.
DISCLAIMER
This script is for educational and informational purposes only. It is not financial advice and does not recommend buying or selling any instrument. Past behavior does not guarantee future results. Use at your own risk.
==================================================
日本語(Japanese)
概要
5つの主要通貨(USD、EUR、GBP、AUD、JPY)の相対的な強さを、5通貨で作れる10ペアすべてを使って表示します。主にドル円を見る人向けで、5本の強弱の線に加えて、USDとJPYの強弱の差を棒で表示します。ドル円の動きが「ドル側」「円側」「両方」のどれによるものかを見分ける助けになります。
売買のサインやアラートは出しません。通貨の流れを理解するための表示ツールです。
仕組み
1. 価格:チャートと同じ時間足で、上記10ペアの終値を取得します。常に通常のローソク足の価格(ticker.standard)を使うため、平均足チャートでも値は変わりません。
2. 各ペアの変化:変化率 = 100 × ln(価格 ÷ 基準の価格)。基準は「直近N本」(N本前の終値、初期値14)か「セッション開始」(指定したセッションの最初の足の終値、初期値 09:00-15:00 東京時間)を選べます。
3. 各通貨の強さ:各通貨は10ペアのうち4ペアに含まれます。その4ペアの変化の平均を強さとし、通貨が後ろ側(決済通貨)のときは符号を反転します。対数の変化を使うため、5通貨の合計はほぼ0になります。0より上は、その期間で他の通貨の平均より強いことを意味します。
4. 滑らかさ:単純移動平均(初期値3本)をかけます。「セッション開始」では滑らかさもセッション開始でリセットされ、最初の足は必ず0になります。
5. 正規化(任意):各ペアの変化を、そのペアの普段の値動きの大きさ(1本ごとの変化の標準偏差 × √経過本数)で割ります。時間足が違っても値の大きさがそろい、値動きの大きいペアの影響が小さくなります。
6. USD−JPY強弱差:棒は(USDの強さ − JPYの強さ)です。プラス(薄い赤)はUSDがJPYより強い、マイナス(薄い灰色)はJPYがUSDより強い状態です。
一般的な通貨強弱との違い
・ドル円特化:USD−JPYの強弱差を直接表示し、「ドル高」と「円安」を分けて見られます。
・セッション開始の基準点:東京・ロンドン・NYなど、指定したセッションの開始で0にリセットできます。
・正規化(任意):時間足やペアの間で値の大きさを比べやすくします。
・提供元の自動選択:初期設定では、チャートと同じ提供元から10ペアを取得し、価格と時刻を表示中の銘柄に合わせます。実際に使っている提供元は表示欄の右下に出ます。
・右のラベルは強い順に並び、重ならないように間隔を空けます。
使い方
・FXのチャートに追加します(ドル円がおすすめですが、どのFXチャートでも使えます)。
・「直近N本」で最近の強弱のバランスを、日中の足の「セッション開始」で市場の開始からの流れを見ます。
・棒を見て、ドル円の動きがUSD・JPY・両方のどれによるものかを確認します。
・表示は過去と現在の価格変化を表すもので、将来の価格を予測するものではありません。
限界
・提供元が10ペアすべてを扱っている必要があります。FX以外のチャートでは「チャートと同じ提供元を使う」をオフにし、FXの提供元を手入力してください。
・「セッション開始」は日中の足でのみ使えます。日足以上では線が表示されず、案内が出ます。
・1分足などでは、取引のない足があるペアがあります。その場合は直前の終値を使うため、そのペアの反応が遅れることがあります。
・提供元によって価格が少し違うため、値も少し違います。
・滑らかさによって、少し遅れが出ます。
・確定した過去の足の値は変わりません(先読みは使っていません)。確定前の最新の足は、確定するまで動きます。
・強さは相対的なものです。5本は互いに比べた値なので、常に0のまわりでつり合います。
免責
このスクリプトは学習と情報提供を目的としたものです。投資助言ではなく、売買を推奨するものではありません。過去の動きは将来の結果を保証しません。ご利用は自己責任でお願いします。
This indicator measures the relative strength of five major currencies (USD, EUR, GBP, AUD, JPY) using all 10 pairs that can be formed from them. It is designed mainly for USDJPY traders: in addition to the five strength lines, it plots the strength difference between USD and JPY as columns, so you can see whether a USDJPY move is driven by the dollar side, the yen side, or both.
The indicator does not generate buy/sell signals or alerts. It is a visual tool to help understand currency flows.
HOW IT WORKS
1. Price data
The script requests the close of these 10 pairs on the chart's timeframe:
EURUSD, GBPUSD, AUDUSD, USDJPY, EURGBP, EURAUD, EURJPY, GBPAUD, GBPJPY, AUDJPY.
Prices are always requested with standard candles (ticker.standard), so the values stay the same on Heikin Ashi charts.
2. Change of each pair
For each pair, the log change in percent is calculated:
change = 100 x ln(price / base price)
The base price can be:
- Last N bars: the close N bars ago (default N = 14).
- Session start: the close of the first bar of the selected session (default 09:00-15:00 Asia/Tokyo). All lines start from 0 at the session open.
3. Strength of each currency
Each currency appears in 4 of the 10 pairs. Its strength is the average of those 4 changes, with the sign flipped when the currency is the quote currency. Example:
USD = ( -EURUSD - GBPUSD - AUDUSD + USDJPY ) / 4
JPY = ( -USDJPY - EURJPY - GBPJPY - AUDJPY ) / 4
Because log changes are used, the five strengths always sum to about zero. A line above 0 means that currency is stronger than the average of the others over the selected period.
4. Smoothing
A simple moving average (default 3 bars) is applied. In Session start mode, the smoothing also restarts at the session open, so the first bar of the session is exactly 0.
5. Optional normalization
When "Normalize" is on, each pair's change is divided by its typical volatility:
normalized = change / ( stdev of 1-bar changes over "Normalize length" bars x sqrt(k) )
where k is N (Last N bars mode) or the number of bars since the session open (Session start mode). This keeps the values on a similar scale across timeframes (roughly -2 to +2 in most conditions) and reduces the effect of more volatile pairs.
6. USD-JPY spread
The columns show (USD strength - JPY strength). Positive (light red) means USD is stronger than JPY; negative (light gray) means JPY is stronger than USD.
WHAT IS DIFFERENT FROM A TYPICAL CURRENCY STRENGTH INDICATOR
- USDJPY focus: the USD-JPY strength difference is plotted directly, so you can separate "dollar strength" from "yen weakness".
- Session-start base point: strengths can be reset to 0 at the Tokyo, London or New York open (any session you set), which shows how each currency has moved since the session began.
- Optional volatility normalization, so the scale is comparable between timeframes and pairs.
- Data source follows the chart: by default the 10 pairs are requested from the same data provider as your chart, so prices and timestamps match the symbol you are viewing. The source actually used is shown at the bottom right of the pane.
- Labels on the right are sorted from strongest to weakest and spaced so they do not overlap.
HOW TO USE
- Add it to a forex chart (USDJPY is recommended, but any FX chart works).
- Use "Last N bars" to see the recent balance of strength, or "Session start" on intraday charts to see the flow since a market open.
- Watch the columns to see whether USDJPY is moving because of USD, JPY, or both. For example, rising USDJPY with a small spread and a falling JPY line suggests the move is mainly yen weakness.
- These readings describe past and current price changes only. They do not predict future prices.
INPUTS (Japanese label [English])
Calculation
- 基準点 [Base point]: Last N bars / Session start
- 強弱計算期間 [Lookback period]: N for Last N bars mode
- 滑らかさ [Smoothing]: SMA length
- チャートと同じ提供元を使う [Use chart's data source]: on = use the chart's provider
- データ提供元(手入力) [Data source, manual]: provider used when the option above is off (e.g. OANDA, FX, FOREXCOM)
- 正規化 [Normalize]: volatility normalization on/off
- 正規化の期間 [Normalize length]: bars used for the volatility estimate
Session
- セッション時間 [Session time]: session used for Session start mode
- タイムゾーン [Time zone]: Asia/Tokyo, Europe/London, America/New_York
Display
- USD-JPY 強弱差を表示 [Show USD-JPY spread]: columns on/off
- ラベルの右オフセット [Label offset]: distance of the labels from the last bar
- ラベルの間隔 [Label spacing, smaller = wider]: minimum gap between labels
On-chart texts
- 提供元 [Source]: the data provider actually used
- セッション開始は日中の足でのみ使えます [Session start: intraday only]
LIMITATIONS
- The data provider must offer all 10 pairs. On non-forex charts (for example futures or crypto), turn off "Use chart's data source" and enter a forex provider manually.
- Session start mode works only on intraday timeframes. On daily or higher timeframes the lines are not shown and a notice is displayed.
- On low timeframes such as 1 minute, some pairs may have no trades on some bars. In that case the last known close is used, which can delay the reaction of that pair.
- Values differ slightly between data providers because their prices are not identical.
- Smoothing adds a small delay.
- Historical bars do not change after they close (no lookahead is used). The value of the current, unclosed bar updates in real time until the bar closes.
- Strength is relative: all five lines are measured against each other, so they always balance around zero. A rising line means relative strength, not an absolute rise in value.
DISCLAIMER
This script is for educational and informational purposes only. It is not financial advice and does not recommend buying or selling any instrument. Past behavior does not guarantee future results. Use at your own risk.
==================================================
日本語(Japanese)
概要
5つの主要通貨(USD、EUR、GBP、AUD、JPY)の相対的な強さを、5通貨で作れる10ペアすべてを使って表示します。主にドル円を見る人向けで、5本の強弱の線に加えて、USDとJPYの強弱の差を棒で表示します。ドル円の動きが「ドル側」「円側」「両方」のどれによるものかを見分ける助けになります。
売買のサインやアラートは出しません。通貨の流れを理解するための表示ツールです。
仕組み
1. 価格:チャートと同じ時間足で、上記10ペアの終値を取得します。常に通常のローソク足の価格(ticker.standard)を使うため、平均足チャートでも値は変わりません。
2. 各ペアの変化:変化率 = 100 × ln(価格 ÷ 基準の価格)。基準は「直近N本」(N本前の終値、初期値14)か「セッション開始」(指定したセッションの最初の足の終値、初期値 09:00-15:00 東京時間)を選べます。
3. 各通貨の強さ:各通貨は10ペアのうち4ペアに含まれます。その4ペアの変化の平均を強さとし、通貨が後ろ側(決済通貨)のときは符号を反転します。対数の変化を使うため、5通貨の合計はほぼ0になります。0より上は、その期間で他の通貨の平均より強いことを意味します。
4. 滑らかさ:単純移動平均(初期値3本)をかけます。「セッション開始」では滑らかさもセッション開始でリセットされ、最初の足は必ず0になります。
5. 正規化(任意):各ペアの変化を、そのペアの普段の値動きの大きさ(1本ごとの変化の標準偏差 × √経過本数)で割ります。時間足が違っても値の大きさがそろい、値動きの大きいペアの影響が小さくなります。
6. USD−JPY強弱差:棒は(USDの強さ − JPYの強さ)です。プラス(薄い赤)はUSDがJPYより強い、マイナス(薄い灰色)はJPYがUSDより強い状態です。
一般的な通貨強弱との違い
・ドル円特化:USD−JPYの強弱差を直接表示し、「ドル高」と「円安」を分けて見られます。
・セッション開始の基準点:東京・ロンドン・NYなど、指定したセッションの開始で0にリセットできます。
・正規化(任意):時間足やペアの間で値の大きさを比べやすくします。
・提供元の自動選択:初期設定では、チャートと同じ提供元から10ペアを取得し、価格と時刻を表示中の銘柄に合わせます。実際に使っている提供元は表示欄の右下に出ます。
・右のラベルは強い順に並び、重ならないように間隔を空けます。
使い方
・FXのチャートに追加します(ドル円がおすすめですが、どのFXチャートでも使えます)。
・「直近N本」で最近の強弱のバランスを、日中の足の「セッション開始」で市場の開始からの流れを見ます。
・棒を見て、ドル円の動きがUSD・JPY・両方のどれによるものかを確認します。
・表示は過去と現在の価格変化を表すもので、将来の価格を予測するものではありません。
限界
・提供元が10ペアすべてを扱っている必要があります。FX以外のチャートでは「チャートと同じ提供元を使う」をオフにし、FXの提供元を手入力してください。
・「セッション開始」は日中の足でのみ使えます。日足以上では線が表示されず、案内が出ます。
・1分足などでは、取引のない足があるペアがあります。その場合は直前の終値を使うため、そのペアの反応が遅れることがあります。
・提供元によって価格が少し違うため、値も少し違います。
・滑らかさによって、少し遅れが出ます。
・確定した過去の足の値は変わりません(先読みは使っていません)。確定前の最新の足は、確定するまで動きます。
・強さは相対的なものです。5本は互いに比べた値なので、常に0のまわりでつり合います。
免責
このスクリプトは学習と情報提供を目的としたものです。投資助言ではなく、売買を推奨するものではありません。過去の動きは将来の結果を保証しません。ご利用は自己責任でお願いします。

Clause de non-responsabilité
Les informations et publications ne sont pas destinées à être, et ne constituent pas, des conseils ou recommandations financiers, d'investissement, de trading ou autres fournis ou approuvés par TradingView. Pour en savoir plus, consultez les Conditions d'utilisation.
Clause de non-responsabilité
Les informations et publications ne sont pas destinées à être, et ne constituent pas, des conseils ou recommandations financiers, d'investissement, de trading ou autres fournis ou approuvés par TradingView. Pour en savoir plus, consultez les Conditions d'utilisation.