Mis à jour
Volatility Regime Tracker | NickJoan
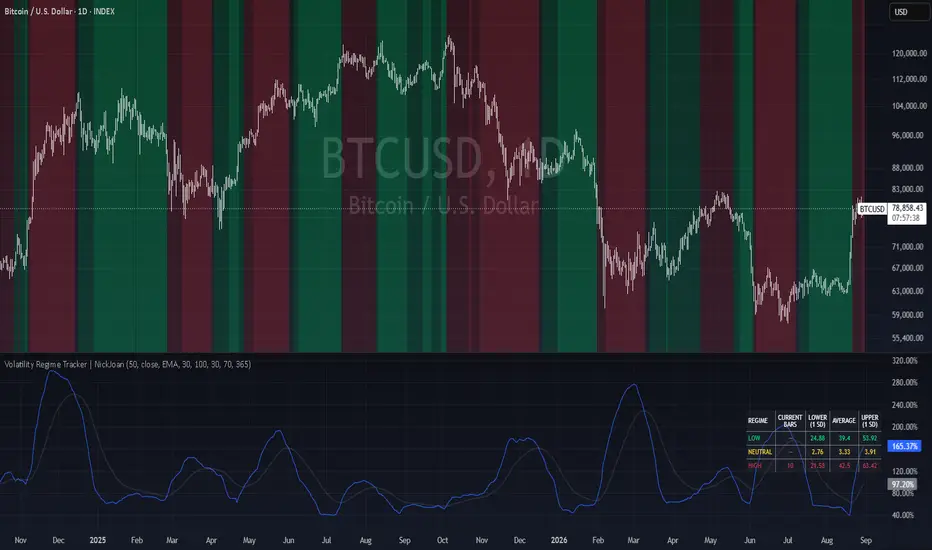
Volatility Regime Tracker | NickJoan
Core Idea
Volatility Regime Tracker measures the dispersion of price relative to its recent average and classifies the current market environment into distinct volatility states. Instead of just showing raw volatility values, the indicator uses percentile-based thresholds combined with moving average direction to identify three persistent regimes: LOW, NEUTRAL, and HIGH.
The script goes beyond simple volatility measurement by tracking how long each regime has lasted and comparing it to historical averages, giving you a statistical expectation for when the current regime might end.
The indicator can be used in two ways:
• As a volatility gauge, where you monitor the current volatility percentage and its trend.
• As a regime detection tool, where the background colors and duration table help you anticipate volatility state changes.
Calculation Logic
The indicator works through three main stages:
1. Volatility calculation
For the selected price source, the script first calculates the standard deviation over a user-defined lookback window. This absolute volatility is then normalized by the average price to produce a percentage-based measure.
• The script calculates the standard deviation of the source over the lookback period.
• It calculates the simple moving average of the source over the same period.
• It divides standard deviation by average price and multiplies by 100.
• It optionally annualizes the result using √365 for crypto daily charts.
This creates a coefficient of variation measure that shows how much price typically deviates from its recent average as a percentage.
2. Regime classification
The script then determines whether current volatility is high, low, or neutral relative to recent history.
• It calculates the percentile rank of current volatility over a regime lookback window.
• It compares this percentile to user-defined thresholds (default: 30th and 70th percentiles).
• It classifies volatility as HIGH (above upper threshold), LOW (below lower threshold), or NEUTRAL (between thresholds).
3. Dual confirmation
To reduce false signals, the script combines percentile ranking with moving average direction.
• It calculates a moving average of the volatility series.
• It checks whether current volatility is above or below this MA.
• It assigns regime states based on both percentile and MA direction.
This dual-confirmation approach produces five distinct visual states that map to three underlying regimes.
Background Color Logic
The script uses a two-layer color system to show both regime state and confidence level.
Strong signals (darker colors)
• Dark red: High percentile AND above MA (strong high volatility)
• Dark green: Low percentile AND below MA (strong low volatility)
Moderate signals (lighter colors)
• Light red: Neutral percentile but above MA (rising volatility)
• Light green: Neutral percentile but below MA (falling volatility)
Uncertain signals
• Gray: Percentile and MA direction disagree (conflicting signals)
This color structure allows you to distinguish between high-confidence regime readings and transitional or uncertain states.
Regime State Mapping
The indicator consolidates the five color states into three regime categories for duration tracking:
• LOW (0): Any green shade (dark or light) - volatility is low or falling
• NEUTRAL (1): Gray - volatility is in transition or conflicting
• HIGH (2): Any red shade (dark or light) - volatility is high or rising
This mapping ensures the duration statistics reflect the broader regime environment rather than short-term color fluctuations.
Duration Tracking Logic
The script continuously monitors regime changes and builds a historical record of how long each regime typically lasts.
Duration measurement
• When a regime change is detected, the script calculates how many bars the previous regime lasted.
• This duration is stored in an array specific to that regime type (LOW, NEUTRAL, or HIGH).
• The process repeats for each regime change, building a distribution of historical durations.
Statistical analysis
• The script calculates the average duration for each regime type from the stored history.
• It calculates the standard deviation of those durations.
• It computes confidence intervals at ±1 standard deviation (~68% confidence).
Real-time tracking
• The script counts how many bars the current regime has lasted.
• It displays this count alongside the historical average and confidence bounds.
• This allows you to see whether the current regime is typical, unusually short, or unusually long.
Duration Table Output
The table displays four rows of information for each regime type:
• Current bars in regime (if active) or "—" (if inactive)
• Historical average duration for LOW regimes
• Lower bound (average − 1 SD)
• Upper bound (average + 1 SD)
Interpretation
• If current bars < lower bound: regime is unusually short (may extend further)
• If current bars ≈ average: regime is typical (no strong expectation either way)
• If current bars > upper bound: regime is unusually long (may be nearing end)
Chart Output
The indicator displays three visual elements in a separate pane below the price chart:
Volatility line
• Shows the current annualized volatility percentage
• Plotted in blue for clear visibility
Moving average line
• Shows the smoothed volatility trend
• Plotted in gray with thicker linewidth
• Can be toggled off via input
Background color
• Shows the current volatility regime state
• Uses five color states mapped to three regimes
• Can be toggled off via input
Duration table
• Positioned at middle-right of the chart
• Shows current bars, average, and confidence intervals
• Can be toggled off via input
Inputs
The indicator has four main input groups.
CALCULATION
• Volatility Lookback (bars): defines the window used to calculate standard deviation. Default: 50.
• Annualize (√365): toggles annualization of volatility. Recommended for crypto daily charts.
• Source: selects the price series used in the calculation (default: close).
MOVING AVERAGE
• Type: chooses the MA type (SMA, EMA, WMA, RMA). Default: EMA.
• Length: sets the MA lookback period. Default: 30.
• Show Moving Average: toggles MA visibility on the chart.
VOLATILITY REGIME
• Regime Lookback (bars): defines the window used for percentile rank calculation. Default: 100.
• Low Threshold (percentile): sets the lower percentile boundary. Default: 30.
• High Threshold (percentile): sets the upper percentile boundary. Default: 70.
• Show Background Color: toggles regime coloring.
DURATION TABLE
• Show Duration Table: toggles the statistics table visibility.
• History Lookback (days): controls how many bars of history to use for average calculations. Default: 365.
Alerts
The script includes four alert conditions:
Volatility Regime Change
• Triggers on any regime transition (LOW → NEUTRAL, NEUTRAL → HIGH, etc.)
• Useful for monitoring all state changes
Low Volatility Regime
• Triggers when entering LOW regime (green background)
• Useful for breakout preparation or position size increase
Neutral Volatility Regime
• Triggers when entering NEUTRAL regime (gray background)
• Useful for identifying transition periods
High Volatility Regime
• Triggers when entering HIGH regime (red background)
• Useful for risk reduction or heightened awareness
How to Use It
This indicator is best used as a volatility filter and regime-aware positioning tool, not as a standalone entry signal.
Volatility regime filter
Use the regime colors to filter your trading approach:
• LOW regimes (green): Favor breakout strategies, increase position size
• HIGH regimes (red): Reduce position size, exercise caution (volatility can persist or reverse depending on market context)
• NEUTRAL regimes (gray): Wait for clearer signals or reduce exposure
Duration-based anticipation
Use the duration table to anticipate regime changes:
• If current bars approach upper bound: expect potential regime change soon
• If current bars are well below average: expect regime to continue
• If current bars exceed upper bound: regime is extended, watch for reversal
Trend confirmation
Use the volatility trend to confirm price action:
• Rising volatility (light red → dark red): confirms trend expansion or increased uncertainty
• Falling volatility (light green → dark green): confirms consolidation or stabilization
• Conflicting signals (gray): suggests uncertainty or transition
Practical Interpretation
Here is a simple way to read the results:
LOW regime (green)
• Price is tightly clustered around its average
• Volatility is below historical norms
• Often precedes breakout moves
• Good for trend-following entries
HIGH regime (red)
• Price is widely dispersed from its average
• Volatility is above historical norms
• Can indicate trending expansion, shock events, or panic conditions
• Reduce position size; assess whether context suggests continuation or reversion
NEUTRAL regime (gray)
• Volatility is transitioning or conflicting
• No clear regime signal
• Wait for clearer confirmation
Duration statistics
• Average: typical length of this regime type
• Lower/Upper bounds: normal range (~68% of cases)
• Current bars: where you are in the distribution
Best Use Cases
Typical uses include:
• Crypto volatility regime detection
• Position sizing based on volatility state
• Breakout vs. consolidation strategy filter
• Risk management and exposure control
• Multi-asset volatility comparison
• Regime-aware trade timing
It is especially useful when you want to objectively measure whether volatility is high or low relative to recent history, and whether the current regime is typical or extended.
Notes
The indicator is designed for daily crypto charts but works on any timeframe.
• Daily timeframe: "History Lookback (days)" represents calendar days
• Other timeframes: "History Lookback (days)" represents bars, not calendar days
The metric table is only as good as the selected lookback periods and thresholds.
• Shorter volatility lookback: more reactive but noisier
• Longer volatility lookback: smoother but may lag sudden changes
• Shorter regime lookback: faster regime detection but more whipsaws
• Longer regime lookback: more stable but slower to detect changes
• Tighter thresholds (e.g., 25/75): fewer regime changes, higher confidence
• Wider thresholds (e.g., 35/65): more regime changes, earlier detection
The Z-Score-style duration statistics are relative to the selected history window, so their meaning depends on how much data you include.
Core Idea
Volatility Regime Tracker measures the dispersion of price relative to its recent average and classifies the current market environment into distinct volatility states. Instead of just showing raw volatility values, the indicator uses percentile-based thresholds combined with moving average direction to identify three persistent regimes: LOW, NEUTRAL, and HIGH.
The script goes beyond simple volatility measurement by tracking how long each regime has lasted and comparing it to historical averages, giving you a statistical expectation for when the current regime might end.
The indicator can be used in two ways:
• As a volatility gauge, where you monitor the current volatility percentage and its trend.
• As a regime detection tool, where the background colors and duration table help you anticipate volatility state changes.
Calculation Logic
The indicator works through three main stages:
1. Volatility calculation
For the selected price source, the script first calculates the standard deviation over a user-defined lookback window. This absolute volatility is then normalized by the average price to produce a percentage-based measure.
• The script calculates the standard deviation of the source over the lookback period.
• It calculates the simple moving average of the source over the same period.
• It divides standard deviation by average price and multiplies by 100.
• It optionally annualizes the result using √365 for crypto daily charts.
This creates a coefficient of variation measure that shows how much price typically deviates from its recent average as a percentage.
2. Regime classification
The script then determines whether current volatility is high, low, or neutral relative to recent history.
• It calculates the percentile rank of current volatility over a regime lookback window.
• It compares this percentile to user-defined thresholds (default: 30th and 70th percentiles).
• It classifies volatility as HIGH (above upper threshold), LOW (below lower threshold), or NEUTRAL (between thresholds).
3. Dual confirmation
To reduce false signals, the script combines percentile ranking with moving average direction.
• It calculates a moving average of the volatility series.
• It checks whether current volatility is above or below this MA.
• It assigns regime states based on both percentile and MA direction.
This dual-confirmation approach produces five distinct visual states that map to three underlying regimes.
Background Color Logic
The script uses a two-layer color system to show both regime state and confidence level.
Strong signals (darker colors)
• Dark red: High percentile AND above MA (strong high volatility)
• Dark green: Low percentile AND below MA (strong low volatility)
Moderate signals (lighter colors)
• Light red: Neutral percentile but above MA (rising volatility)
• Light green: Neutral percentile but below MA (falling volatility)
Uncertain signals
• Gray: Percentile and MA direction disagree (conflicting signals)
This color structure allows you to distinguish between high-confidence regime readings and transitional or uncertain states.
Regime State Mapping
The indicator consolidates the five color states into three regime categories for duration tracking:
• LOW (0): Any green shade (dark or light) - volatility is low or falling
• NEUTRAL (1): Gray - volatility is in transition or conflicting
• HIGH (2): Any red shade (dark or light) - volatility is high or rising
This mapping ensures the duration statistics reflect the broader regime environment rather than short-term color fluctuations.
Duration Tracking Logic
The script continuously monitors regime changes and builds a historical record of how long each regime typically lasts.
Duration measurement
• When a regime change is detected, the script calculates how many bars the previous regime lasted.
• This duration is stored in an array specific to that regime type (LOW, NEUTRAL, or HIGH).
• The process repeats for each regime change, building a distribution of historical durations.
Statistical analysis
• The script calculates the average duration for each regime type from the stored history.
• It calculates the standard deviation of those durations.
• It computes confidence intervals at ±1 standard deviation (~68% confidence).
Real-time tracking
• The script counts how many bars the current regime has lasted.
• It displays this count alongside the historical average and confidence bounds.
• This allows you to see whether the current regime is typical, unusually short, or unusually long.
Duration Table Output
The table displays four rows of information for each regime type:
• Current bars in regime (if active) or "—" (if inactive)
• Historical average duration for LOW regimes
• Lower bound (average − 1 SD)
• Upper bound (average + 1 SD)
Interpretation
• If current bars < lower bound: regime is unusually short (may extend further)
• If current bars ≈ average: regime is typical (no strong expectation either way)
• If current bars > upper bound: regime is unusually long (may be nearing end)
Chart Output
The indicator displays three visual elements in a separate pane below the price chart:
Volatility line
• Shows the current annualized volatility percentage
• Plotted in blue for clear visibility
Moving average line
• Shows the smoothed volatility trend
• Plotted in gray with thicker linewidth
• Can be toggled off via input
Background color
• Shows the current volatility regime state
• Uses five color states mapped to three regimes
• Can be toggled off via input
Duration table
• Positioned at middle-right of the chart
• Shows current bars, average, and confidence intervals
• Can be toggled off via input
Inputs
The indicator has four main input groups.
CALCULATION
• Volatility Lookback (bars): defines the window used to calculate standard deviation. Default: 50.
• Annualize (√365): toggles annualization of volatility. Recommended for crypto daily charts.
• Source: selects the price series used in the calculation (default: close).
MOVING AVERAGE
• Type: chooses the MA type (SMA, EMA, WMA, RMA). Default: EMA.
• Length: sets the MA lookback period. Default: 30.
• Show Moving Average: toggles MA visibility on the chart.
VOLATILITY REGIME
• Regime Lookback (bars): defines the window used for percentile rank calculation. Default: 100.
• Low Threshold (percentile): sets the lower percentile boundary. Default: 30.
• High Threshold (percentile): sets the upper percentile boundary. Default: 70.
• Show Background Color: toggles regime coloring.
DURATION TABLE
• Show Duration Table: toggles the statistics table visibility.
• History Lookback (days): controls how many bars of history to use for average calculations. Default: 365.
Alerts
The script includes four alert conditions:
Volatility Regime Change
• Triggers on any regime transition (LOW → NEUTRAL, NEUTRAL → HIGH, etc.)
• Useful for monitoring all state changes
Low Volatility Regime
• Triggers when entering LOW regime (green background)
• Useful for breakout preparation or position size increase
Neutral Volatility Regime
• Triggers when entering NEUTRAL regime (gray background)
• Useful for identifying transition periods
High Volatility Regime
• Triggers when entering HIGH regime (red background)
• Useful for risk reduction or heightened awareness
How to Use It
This indicator is best used as a volatility filter and regime-aware positioning tool, not as a standalone entry signal.
Volatility regime filter
Use the regime colors to filter your trading approach:
• LOW regimes (green): Favor breakout strategies, increase position size
• HIGH regimes (red): Reduce position size, exercise caution (volatility can persist or reverse depending on market context)
• NEUTRAL regimes (gray): Wait for clearer signals or reduce exposure
Duration-based anticipation
Use the duration table to anticipate regime changes:
• If current bars approach upper bound: expect potential regime change soon
• If current bars are well below average: expect regime to continue
• If current bars exceed upper bound: regime is extended, watch for reversal
Trend confirmation
Use the volatility trend to confirm price action:
• Rising volatility (light red → dark red): confirms trend expansion or increased uncertainty
• Falling volatility (light green → dark green): confirms consolidation or stabilization
• Conflicting signals (gray): suggests uncertainty or transition
Practical Interpretation
Here is a simple way to read the results:
LOW regime (green)
• Price is tightly clustered around its average
• Volatility is below historical norms
• Often precedes breakout moves
• Good for trend-following entries
HIGH regime (red)
• Price is widely dispersed from its average
• Volatility is above historical norms
• Can indicate trending expansion, shock events, or panic conditions
• Reduce position size; assess whether context suggests continuation or reversion
NEUTRAL regime (gray)
• Volatility is transitioning or conflicting
• No clear regime signal
• Wait for clearer confirmation
Duration statistics
• Average: typical length of this regime type
• Lower/Upper bounds: normal range (~68% of cases)
• Current bars: where you are in the distribution
Best Use Cases
Typical uses include:
• Crypto volatility regime detection
• Position sizing based on volatility state
• Breakout vs. consolidation strategy filter
• Risk management and exposure control
• Multi-asset volatility comparison
• Regime-aware trade timing
It is especially useful when you want to objectively measure whether volatility is high or low relative to recent history, and whether the current regime is typical or extended.
Notes
The indicator is designed for daily crypto charts but works on any timeframe.
• Daily timeframe: "History Lookback (days)" represents calendar days
• Other timeframes: "History Lookback (days)" represents bars, not calendar days
The metric table is only as good as the selected lookback periods and thresholds.
• Shorter volatility lookback: more reactive but noisier
• Longer volatility lookback: smoother but may lag sudden changes
• Shorter regime lookback: faster regime detection but more whipsaws
• Longer regime lookback: more stable but slower to detect changes
• Tighter thresholds (e.g., 25/75): fewer regime changes, higher confidence
• Wider thresholds (e.g., 35/65): more regime changes, earlier detection
The Z-Score-style duration statistics are relative to the selected history window, so their meaning depends on how much data you include.
Notes de version
Update• Added an optional Percentile Rank label.
• The label displays the current volatility percentile rank.
• Label color changes according to percentile rank:
- Red: high volatility.
- Lime: low volatility.
- Gray: neutral volatility.
• Added an input to show or hide the percentile label.
• Background regime logic still considers both percentile rank and moving-average direction.

Clause de non-responsabilité
Les informations et publications ne sont pas destinées à être, et ne constituent pas, des conseils ou recommandations financiers, d'investissement, de trading ou autres fournis ou approuvés par TradingView. Pour en savoir plus, consultez les Conditions d'utilisation.
Clause de non-responsabilité
Les informations et publications ne sont pas destinées à être, et ne constituent pas, des conseils ou recommandations financiers, d'investissement, de trading ou autres fournis ou approuvés par TradingView. Pour en savoir plus, consultez les Conditions d'utilisation.