UniEMA Cascade
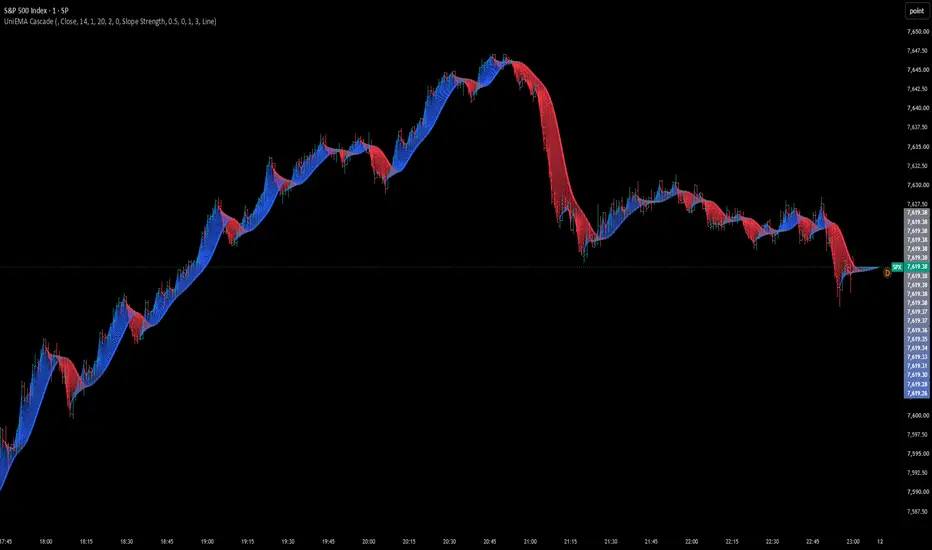
█ OVERVIEW
UniEMA Cascade is the author's extended implementation of the UniEMA — the Universal Exponential Moving Average introduced by Igor Durkin in the article "The UniEMA: A Universal Exponential Moving Average" (Technical Analysis of Stocks & Commodities, November 2026). Code for other platforms is available in the November 2026 Traders' Tips.
UniEMA is built as a chain of exponential smoothing stages. A standard implementation shows only the final output. This script draws all of them at once, so you can see how a price move travels through the filter: the fastest stages react first, the slowest last. The result is a ribbon in which the width, ordering and color of the lines describe the speed, direction and maturity of the move.
The final stage — the regular UniEMA with the same settings — is drawn as a thicker line on top of the cascade.
█ CONCEPTS
UniEMA is controlled by four parameters besides Length:
• Poles — the structure of each stage. One pole is a plain EMA; two and three poles add DEMA- and TEMA-type lag correction.
• Order — the number of stages applied in sequence. Each stage smooths the output of the previous one. In this script every stage is plotted as a separate line.
• Weight Factor — the smoothing convention: 1 = Wilder, 2 = standard EMA.
• Damping Factor — the strength of the lag correction between poles: 0 = none, 1 = full. It has no effect with one pole.
The smoothing coefficient is scaled by Order, so the total lag of the final line stays (Length − 1) / Weight Factor regardless of how many stages are used. With one pole the lag of stage k is k × (Length − 1) / (Weight Factor × Order): the stages are spread evenly between price and the final UniEMA.
The default settings (Length 14, Poles 1, Order 20, Weight Factor 2, Damping 0) reproduce the cascade example from the article.
█ COLORING MODES
• Slope Strength (default) — speed and direction. Each line's change is divided by the average absolute change of the selected price over the Slope Period. The ratio works much like an efficiency ratio: close to 1 in a clean trend, close to 0 in chop. Flat lines take the Neutral Color; as the ratio grows they move toward the UpTrend or DnTrend Color. Strong legs show as saturated ribbons, consolidations fade out, and at turning points the fast stages change color before the slow ones.
• Speed — speed only, direction ignored. Lines move from Slow Color at a flat slope to Fast Color at full speed. Direction is read from the order of the lines in the ribbon. The most useful feature of this mode is deceleration: before a reversal the fast stages turn from Fast to Slow Color as their speed drops to zero at the extreme, before they actually change direction.
• Slope — direction only, UpTrend / DnTrend Color.
• Gradient — color by stage number, from Fast Color (stage 1) to Slow Color (last stage). It carries no market information of its own; use it to study the structure of the cascade — ordering, expansion, compression and twists of the ribbon.
█ RECOMMENDED SETTINGS
• Slope Scale sets the ratio at which a line reaches full color. Good starting points:
– Slope Strength: 0.5
– Speed: about 1.0 (at 0.5 most lines look fully "fast", because the Slow and Fast colors are both opaque and contrast strongly)
• Smoothed price types (Heikin-Ashi, Average, Median) have a smaller average price change, so lines saturate sooner. Raise Slope Scale accordingly.
• Keep the Neutral Color semi-transparent so that flat parts of the cascade recede behind price.
• Slope Period 0 uses Length. Increase it for a steadier color scale.
• For a higher TimeFrame, switch Line Style to Step.
█ HIGHER TIMEFRAME
Set TimeFrame to plot the cascade calculated on a higher timeframe. All values and colors are computed on the higher-timeframe bars, so the color scale stays consistent. Only confirmed higher-timeframe bars are used, so the cascade does not repaint; each higher-timeframe value appears once that bar has closed.
A timeframe lower than the chart's falls back to the chart timeframe.
█ INPUTS
Calculation
• TimeFrame — see above.
• Price — 26 price types, including Heikin-Ashi variants.
• Length, Poles, Order, Weight Factor, Damping Factor — UniEMA parameters (see Concepts). Order is limited to 30 by the number of plots Pine Script allows in one script.
Display
• Show Cascade — hide the stages and keep only the final UniEMA line.
• Coloring, Slope Scale, Slope Period — see Coloring Modes.
• Neutral, UpTrend, DnTrend, Fast and Slow Colors.
• Cascade Line Width, UniEMA Line Width, Line Style.
█ NOTES
A basic UniEMA implementation accompanying the article is published by PineCodersTASC as "TASC 2026.11 The UniEMA". This script is the author's extended version: the full cascade, multiple coloring modes, 26 price types and higher-timeframe support.
UniEMA Cascade is the author's extended implementation of the UniEMA — the Universal Exponential Moving Average introduced by Igor Durkin in the article "The UniEMA: A Universal Exponential Moving Average" (Technical Analysis of Stocks & Commodities, November 2026). Code for other platforms is available in the November 2026 Traders' Tips.
UniEMA is built as a chain of exponential smoothing stages. A standard implementation shows only the final output. This script draws all of them at once, so you can see how a price move travels through the filter: the fastest stages react first, the slowest last. The result is a ribbon in which the width, ordering and color of the lines describe the speed, direction and maturity of the move.
The final stage — the regular UniEMA with the same settings — is drawn as a thicker line on top of the cascade.
█ CONCEPTS
UniEMA is controlled by four parameters besides Length:
• Poles — the structure of each stage. One pole is a plain EMA; two and three poles add DEMA- and TEMA-type lag correction.
• Order — the number of stages applied in sequence. Each stage smooths the output of the previous one. In this script every stage is plotted as a separate line.
• Weight Factor — the smoothing convention: 1 = Wilder, 2 = standard EMA.
• Damping Factor — the strength of the lag correction between poles: 0 = none, 1 = full. It has no effect with one pole.
The smoothing coefficient is scaled by Order, so the total lag of the final line stays (Length − 1) / Weight Factor regardless of how many stages are used. With one pole the lag of stage k is k × (Length − 1) / (Weight Factor × Order): the stages are spread evenly between price and the final UniEMA.
The default settings (Length 14, Poles 1, Order 20, Weight Factor 2, Damping 0) reproduce the cascade example from the article.
█ COLORING MODES
• Slope Strength (default) — speed and direction. Each line's change is divided by the average absolute change of the selected price over the Slope Period. The ratio works much like an efficiency ratio: close to 1 in a clean trend, close to 0 in chop. Flat lines take the Neutral Color; as the ratio grows they move toward the UpTrend or DnTrend Color. Strong legs show as saturated ribbons, consolidations fade out, and at turning points the fast stages change color before the slow ones.
• Speed — speed only, direction ignored. Lines move from Slow Color at a flat slope to Fast Color at full speed. Direction is read from the order of the lines in the ribbon. The most useful feature of this mode is deceleration: before a reversal the fast stages turn from Fast to Slow Color as their speed drops to zero at the extreme, before they actually change direction.
• Slope — direction only, UpTrend / DnTrend Color.
• Gradient — color by stage number, from Fast Color (stage 1) to Slow Color (last stage). It carries no market information of its own; use it to study the structure of the cascade — ordering, expansion, compression and twists of the ribbon.
█ RECOMMENDED SETTINGS
• Slope Scale sets the ratio at which a line reaches full color. Good starting points:
– Slope Strength: 0.5
– Speed: about 1.0 (at 0.5 most lines look fully "fast", because the Slow and Fast colors are both opaque and contrast strongly)
• Smoothed price types (Heikin-Ashi, Average, Median) have a smaller average price change, so lines saturate sooner. Raise Slope Scale accordingly.
• Keep the Neutral Color semi-transparent so that flat parts of the cascade recede behind price.
• Slope Period 0 uses Length. Increase it for a steadier color scale.
• For a higher TimeFrame, switch Line Style to Step.
█ HIGHER TIMEFRAME
Set TimeFrame to plot the cascade calculated on a higher timeframe. All values and colors are computed on the higher-timeframe bars, so the color scale stays consistent. Only confirmed higher-timeframe bars are used, so the cascade does not repaint; each higher-timeframe value appears once that bar has closed.
A timeframe lower than the chart's falls back to the chart timeframe.
█ INPUTS
Calculation
• TimeFrame — see above.
• Price — 26 price types, including Heikin-Ashi variants.
• Length, Poles, Order, Weight Factor, Damping Factor — UniEMA parameters (see Concepts). Order is limited to 30 by the number of plots Pine Script allows in one script.
Display
• Show Cascade — hide the stages and keep only the final UniEMA line.
• Coloring, Slope Scale, Slope Period — see Coloring Modes.
• Neutral, UpTrend, DnTrend, Fast and Slow Colors.
• Cascade Line Width, UniEMA Line Width, Line Style.
█ NOTES
A basic UniEMA implementation accompanying the article is published by PineCodersTASC as "TASC 2026.11 The UniEMA". This script is the author's extended version: the full cascade, multiple coloring modes, 26 price types and higher-timeframe support.

Clause de non-responsabilité
Les informations et publications ne sont pas destinées à être, et ne constituent pas, des conseils ou recommandations financiers, d'investissement, de trading ou autres fournis ou approuvés par TradingView. Pour en savoir plus, consultez les Conditions d'utilisation.
Clause de non-responsabilité
Les informations et publications ne sont pas destinées à être, et ne constituent pas, des conseils ou recommandations financiers, d'investissement, de trading ou autres fournis ou approuvés par TradingView. Pour en savoir plus, consultez les Conditions d'utilisation.