Mis à jour
Multi-Session POC by Bybllo
Multi-Session POC by Bybllo
What it does
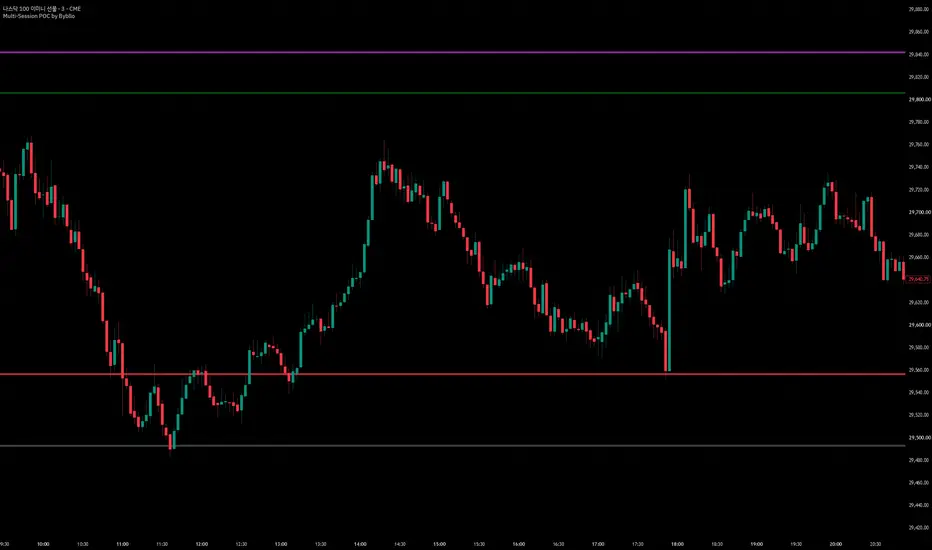
Builds a volume profile for each trading session and draws that session’s Point of Control (POC) - the price level where the most volume traded - as a horizontal line extending to the right. Up to five lines can be shown at once, each taken from a different session (today, 1 day ago, 2 days ago, ...), so you can see at a glance where the heaviest-volume price sat over several recent sessions.
How it works
Each session’s high-low range is split into price buckets of one tick. Every lower-timeframe bar’s volume is distributed over the buckets that its high-low range overlaps, in proportion to the overlap, instead of being split evenly. The bucket with the most volume is the POC.
The calculation uses 1-minute data pulled with request.security_lower_tf(), whatever timeframe the chart shows (on charts of 1 minute or less, the chart’s own bars are used). An optional 1-second mode is available.
Session Detection: Auto-Detect (default) uses TradingView’s own trading-day boundaries for the symbol. Manual mode lets you set a session start hour and a timezone for special cases.
Prices are requested through a plain real-price ticker, so the POC is calculated from real prices even when the chart is Heikin Ashi or another non-standard chart type. On those chart types the session boundary is detected at chart-bar resolution instead of 1-minute resolution.
The POC of the current (in-progress) session is calculated from confirmed bars and updates when a bar closes.
Settings
POC #1 to #5: show/hide, “N days ago” (0 = current session, up to 30), color, width and line style.
Right Extension: how many bars the lines project to the right.
Manual Price Entry: draw lines at prices you type in (0 = unused), for example levels copied from another volume profile tool. “Manual Mode Line Start” sets how far back they begin.
Second-Resolution Data: optional 1-second data. It needs a TradingView plan that supports second-based data (Premium and above); on other plans enabling it causes an error.
How to use
Watch how price behaves when it returns to a prior session’s POC. Several POCs clustered in the same zone may mark a more established area of value. These are discretionary reference levels, not trade signals.
Notes
Up to 30 past sessions are stored.
The symbol must have volume data.
Manual session mode starts a new session only when the bar at the chosen hour follows a gap in the data (longer than 10 minutes or 3 bars), so it suits markets with a daily break. On 24/7 markets use Auto-Detect.
Very old history may have limited lower-timeframe data from your data provider.
Disclaimer
For educational and informational purposes only. This is not financial advice. Past performance does not guarantee future results. Always verify how these levels behave on your symbol and timeframe before relying on them.
What it does
Builds a volume profile for each trading session and draws that session’s Point of Control (POC) - the price level where the most volume traded - as a horizontal line extending to the right. Up to five lines can be shown at once, each taken from a different session (today, 1 day ago, 2 days ago, ...), so you can see at a glance where the heaviest-volume price sat over several recent sessions.
How it works
Each session’s high-low range is split into price buckets of one tick. Every lower-timeframe bar’s volume is distributed over the buckets that its high-low range overlaps, in proportion to the overlap, instead of being split evenly. The bucket with the most volume is the POC.
The calculation uses 1-minute data pulled with request.security_lower_tf(), whatever timeframe the chart shows (on charts of 1 minute or less, the chart’s own bars are used). An optional 1-second mode is available.
Session Detection: Auto-Detect (default) uses TradingView’s own trading-day boundaries for the symbol. Manual mode lets you set a session start hour and a timezone for special cases.
Prices are requested through a plain real-price ticker, so the POC is calculated from real prices even when the chart is Heikin Ashi or another non-standard chart type. On those chart types the session boundary is detected at chart-bar resolution instead of 1-minute resolution.
The POC of the current (in-progress) session is calculated from confirmed bars and updates when a bar closes.
Settings
POC #1 to #5: show/hide, “N days ago” (0 = current session, up to 30), color, width and line style.
Right Extension: how many bars the lines project to the right.
Manual Price Entry: draw lines at prices you type in (0 = unused), for example levels copied from another volume profile tool. “Manual Mode Line Start” sets how far back they begin.
Second-Resolution Data: optional 1-second data. It needs a TradingView plan that supports second-based data (Premium and above); on other plans enabling it causes an error.
How to use
Watch how price behaves when it returns to a prior session’s POC. Several POCs clustered in the same zone may mark a more established area of value. These are discretionary reference levels, not trade signals.
Notes
Up to 30 past sessions are stored.
The symbol must have volume data.
Manual session mode starts a new session only when the bar at the chosen hour follows a gap in the data (longer than 10 minutes or 3 bars), so it suits markets with a daily break. On 24/7 markets use Auto-Detect.
Very old history may have limited lower-timeframe data from your data provider.
Disclaimer
For educational and informational purposes only. This is not financial advice. Past performance does not guarantee future results. Always verify how these levels behave on your symbol and timeframe before relying on them.
Notes de version
Update:Replaced the chart snapshot with a clearer example showing the POC lines.
Clarified a few description sentences.
No changes to the calculations, settings or defaults.
Notes de version
Update:Replaced the chart snapshot again, this time with solid, thicker POC lines so they are easier to see.
Added a tip to the description: line style and width can be changed for each line in the “POC Lines” settings.
No changes to the calculations, settings or defaults.

Clause de non-responsabilité
Les informations et publications ne sont pas destinées à être, et ne constituent pas, des conseils ou recommandations financiers, d'investissement, de trading ou autres fournis ou approuvés par TradingView. Pour en savoir plus, consultez les Conditions d'utilisation.
Clause de non-responsabilité
Les informations et publications ne sont pas destinées à être, et ne constituent pas, des conseils ou recommandations financiers, d'investissement, de trading ou autres fournis ou approuvés par TradingView. Pour en savoir plus, consultez les Conditions d'utilisation.