OPEN-SOURCE SCRIPT
Golden Momentum Spectrum | NAL
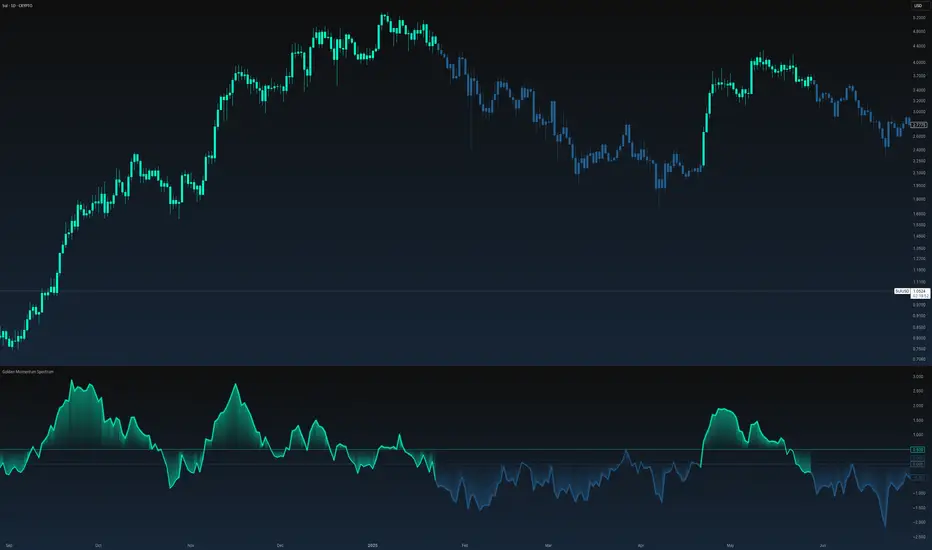
An ancient mathematical proportion, applied to modern market momentum.
The Golden Momentum Spectrum is a multi-horizon momentum framework built around one of mathematics' most recognizable constants: the Golden Ratio (φ ≈ 1.618).
Found throughout geometry, mathematical sequences, and natural growth patterns, the Golden Ratio has fascinated mathematicians for centuries because of its unusual proportional properties.
This indicator brings that same mathematical structure into quantitative market analysis.
Rather than measuring momentum over one arbitrarily selected period, the model constructs three interconnected momentum horizons, where both their temporal spacing and their relative influence are governed by the Golden Ratio.
The result is a volatility-normalized momentum spectrum designed to measure not only directional strength, but whether that strength remains consistent as the observation horizon expands.
1. The Golden Ratio Architecture
The foundation of the model is the mathematical constant:
φ = (1 + √5) / 2 ≈ 1.618034
Instead of manually selecting three unrelated momentum periods, the user defines a single starting horizon. The remaining horizons are derived through successive multiplication by φ.
Pine Script®
With the default starting horizon of 12, the model generates a sequence of approximately 12, 19, and 31 bars.
This creates a proportional progression from shorter-term momentum to broader directional persistence.
The Golden Ratio is therefore not used as an arbitrary price target or Fibonacci retracement level.
It determines the structure through which momentum is observed.
2. Volatility-Normalized Momentum
Each horizon independently measures logarithmic price momentum, standardized by the prevailing volatility of single-bar log returns and the square root of its observation length.
Pine Script®
This normalization places the three momentum observations on a more comparable statistical scale.
Rather than allowing longer horizons to dominate simply because they encompass larger absolute price movements, the model evaluates directional displacement relative to its volatility environment.
The result is three distinct measurements of market momentum, each observing price through a different Golden Ratio-derived horizon.
3. Golden-Weighted Aggregation
The Golden Ratio plays a second role in the model: determining how the three momentum horizons contribute to the final composite.
The weighting structure follows the proportions:
φ² : φ : 1
Pine Script®
This assigns approximately 50% of the composite weight to the fastest horizon, 31% to the intermediate horizon, and 19% to the slowest horizon.
The resulting Golden Momentum series combines short-term responsiveness with progressively broader momentum context.
4. Directional Consensus
Momentum strength alone does not determine the model's final state.
The indicator also evaluates directional agreement across the three horizons, requiring a configurable minimum number of components to support the composite direction.
Users can require agreement from two or all three horizons.
Once established, the directional state persists until the opposing conditions are satisfied, allowing the framework to distinguish temporary momentum disagreement from a confirmed regime transition.
Visuals & Interpretation

The primary oscillator displays the Golden Momentum composite, with its color determined by the prevailing directional regime.
The visualization includes:
• A dynamically colored composite momentum curve.
• A stronger visual glow when all three momentum horizons agree.
• Gradient fills extending toward the relevant directional threshold.
• Optional display of the individual fast, medium, and slow momentum components.
• Trend-colored candles on the main price chart.
• Three selectable color themes: Standard, Nordic, and Simple.
The optional component display is particularly useful for examining how momentum evolves across the Golden Ratio sequence before the complete spectrum reaches directional agreement.
Practical Application
Most conventional momentum indicators evaluate price over a single fixed horizon.
Golden Momentum Spectrum approaches the same problem from a different perspective:
Does directional momentum remain coherent when the observation period expands according to the Golden Ratio?
Its combination of proportional horizon construction, volatility normalization, and directional consensus creates a structured framework for evaluating momentum persistence, multi-horizon agreement, and changing directional regimes.
The Golden Ratio is used as a deliberate mathematical design principle, rather than an assumption that markets must obey a particular numerical constant.
The underlying idea is simple: measure momentum across time, but let mathematics determine the proportions.
Automated Alerts
Two built-in alerts are available:
• Bullish Transition — triggers when the model enters a confirmed bullish regime.
• Bearish Transition — triggers when the model enters a confirmed bearish regime.
Both alert conditions require a confirmed bar and activate only when the directional state changes.
Configuration
Users can customize the starting momentum horizon, volatility normalization period, minimum directional agreement, bullish and bearish thresholds, and visual presentation.
The Golden Ratio relationships are maintained automatically as the starting horizon changes.
The Golden Momentum Spectrum is a multi-horizon momentum framework built around one of mathematics' most recognizable constants: the Golden Ratio (φ ≈ 1.618).
Found throughout geometry, mathematical sequences, and natural growth patterns, the Golden Ratio has fascinated mathematicians for centuries because of its unusual proportional properties.
This indicator brings that same mathematical structure into quantitative market analysis.
Rather than measuring momentum over one arbitrarily selected period, the model constructs three interconnected momentum horizons, where both their temporal spacing and their relative influence are governed by the Golden Ratio.
The result is a volatility-normalized momentum spectrum designed to measure not only directional strength, but whether that strength remains consistent as the observation horizon expands.
1. The Golden Ratio Architecture
The foundation of the model is the mathematical constant:
φ = (1 + √5) / 2 ≈ 1.618034
Instead of manually selecting three unrelated momentum periods, the user defines a single starting horizon. The remaining horizons are derived through successive multiplication by φ.
With the default starting horizon of 12, the model generates a sequence of approximately 12, 19, and 31 bars.
This creates a proportional progression from shorter-term momentum to broader directional persistence.
The Golden Ratio is therefore not used as an arbitrary price target or Fibonacci retracement level.
It determines the structure through which momentum is observed.
2. Volatility-Normalized Momentum
Each horizon independently measures logarithmic price momentum, standardized by the prevailing volatility of single-bar log returns and the square root of its observation length.
This normalization places the three momentum observations on a more comparable statistical scale.
Rather than allowing longer horizons to dominate simply because they encompass larger absolute price movements, the model evaluates directional displacement relative to its volatility environment.
The result is three distinct measurements of market momentum, each observing price through a different Golden Ratio-derived horizon.
3. Golden-Weighted Aggregation
The Golden Ratio plays a second role in the model: determining how the three momentum horizons contribute to the final composite.
The weighting structure follows the proportions:
φ² : φ : 1
This assigns approximately 50% of the composite weight to the fastest horizon, 31% to the intermediate horizon, and 19% to the slowest horizon.
The resulting Golden Momentum series combines short-term responsiveness with progressively broader momentum context.
4. Directional Consensus
Momentum strength alone does not determine the model's final state.
The indicator also evaluates directional agreement across the three horizons, requiring a configurable minimum number of components to support the composite direction.
- Bullish — Golden Momentum exceeds the upper threshold and sufficient horizons exhibit positive momentum.
- Bearish — Golden Momentum falls below the lower threshold and sufficient horizons exhibit negative momentum.
- Full Agreement — all three horizons share the same directional sign, indicating complete directional alignment across the Golden Ratio structure.
Users can require agreement from two or all three horizons.
Once established, the directional state persists until the opposing conditions are satisfied, allowing the framework to distinguish temporary momentum disagreement from a confirmed regime transition.
Visuals & Interpretation
The primary oscillator displays the Golden Momentum composite, with its color determined by the prevailing directional regime.
The visualization includes:
• A dynamically colored composite momentum curve.
• A stronger visual glow when all three momentum horizons agree.
• Gradient fills extending toward the relevant directional threshold.
• Optional display of the individual fast, medium, and slow momentum components.
• Trend-colored candles on the main price chart.
• Three selectable color themes: Standard, Nordic, and Simple.
The optional component display is particularly useful for examining how momentum evolves across the Golden Ratio sequence before the complete spectrum reaches directional agreement.
Practical Application
Most conventional momentum indicators evaluate price over a single fixed horizon.
Golden Momentum Spectrum approaches the same problem from a different perspective:
Does directional momentum remain coherent when the observation period expands according to the Golden Ratio?
Its combination of proportional horizon construction, volatility normalization, and directional consensus creates a structured framework for evaluating momentum persistence, multi-horizon agreement, and changing directional regimes.
The Golden Ratio is used as a deliberate mathematical design principle, rather than an assumption that markets must obey a particular numerical constant.
The underlying idea is simple: measure momentum across time, but let mathematics determine the proportions.
Automated Alerts
Two built-in alerts are available:
• Bullish Transition — triggers when the model enters a confirmed bullish regime.
• Bearish Transition — triggers when the model enters a confirmed bearish regime.
Both alert conditions require a confirmed bar and activate only when the directional state changes.
Configuration
Users can customize the starting momentum horizon, volatility normalization period, minimum directional agreement, bullish and bearish thresholds, and visual presentation.
The Golden Ratio relationships are maintained automatically as the starting horizon changes.
Script open-source
Dans l'esprit TradingView, le créateur de ce script l'a rendu open source afin que les traders puissent examiner et vérifier ses fonctionnalités. Bravo à l'auteur! Bien que vous puissiez l'utiliser gratuitement, n'oubliez pas que la republication du code est soumise à nos Règles.

🔵 Access our best trading & investing tools, get a 30-day free trial today: whop.com/nordic-alpha-lab/
Clause de non-responsabilité
Les informations et publications ne sont pas destinées à être, et ne constituent pas, des conseils ou recommandations financiers, d'investissement, de trading ou autres fournis ou approuvés par TradingView. Pour en savoir plus, consultez les Conditions d'utilisation.
Script open-source
Dans l'esprit TradingView, le créateur de ce script l'a rendu open source afin que les traders puissent examiner et vérifier ses fonctionnalités. Bravo à l'auteur! Bien que vous puissiez l'utiliser gratuitement, n'oubliez pas que la republication du code est soumise à nos Règles.
🔵 Access our best trading & investing tools, get a 30-day free trial today: whop.com/nordic-alpha-lab/
Clause de non-responsabilité
Les informations et publications ne sont pas destinées à être, et ne constituent pas, des conseils ou recommandations financiers, d'investissement, de trading ou autres fournis ou approuvés par TradingView. Pour en savoir plus, consultez les Conditions d'utilisation.